VR CHAIR VS SIMULATOR - THE FEC FORMAT DECISION
VR Chair vs VR Simulator: Which Is Better for an FEC?
Five criteria, published anchors on both sides: the chair as the $6-12K demand test and the simulator row as the 60-90-rides-an-hour monetizer - a sequenced verdict instead of a forced one, with the staged-budget math shown.
5 criteria head-to-head Published anchors both sides Sequenced, not forced Staged-budget pie No cherry-picked verdict Mix compounds both
49-55%
Row Margin (published)
~4.5mo
Chair Payback (published)
1. What It Is: Two Single-Seat Families, One Decision
Both formats seat one guest at a time, both ride on motion, and both sell per session - so the FEC buyer's question is not which is good, but which is better for this floor, this calendar and this budget. The comparison below runs five criteria - space, throughput, audience, operational needs, business model - with every number anchored to the published bands: the chair at $6-12K and $130-320 per chair per day, the simulator row at 60-90 rides an hour and karting's published $18-28K open with 49-55% margins. The anchor-scale version of this decision (arena vs rows) is the published arena-vs-simulator comparison's subject; this guide stays at single-seat scale.
The anchors, so each criterion has a home: the chair's published daily band and ~4.5-month payback (opened in the daily-revenue guide and the ROI calculator); the row's published throughput and OPEX; the moto impulse model's 25-65 rides a day as the middle case; and the $88-135 per-square-meter ceiling that judges either footprint. Planning assumptions, stated in one place: the criteria weights at the end are an EXAMPLE frame for a mid-size FEC - a venue whose party calendar dominates should re-weight audience and throughput.
In one line: the chair is the cheap, flexible demand test; the simulator is the proven-demand monetizer - the mistake is not buying the wrong one, it is buying both in the wrong order.
2. How It Works: The Five Criteria, Head to Head
Space: a published tie at 4-6 square meters per seat, broken by geometry - chairs scatter into corners and corridor ends, rows demand a clean rectangle with circulation. Throughput: the row wins published numbers, 60-90 rides an hour against the chair's demand-limited 12-30; the moto impulse seat's 25-65 rides a day is the styled middle case. Audience: chairs pull impulse riders, siblings and parents - low commitment, high frequency; simulators sell the session - longer, booked, group-shaped. Operational needs: one attendant covers either family from the counter, but chairs multiply content variety cheaply while rows multiply throughput cheaply. Business model: chairs earn the spillover and test the demand; rows carry the party calendar and the leagues - the model the karting guide documents at $7.5-11K monthly.
| Criterion |
VR Chair (published anchors) |
VR Simulator row (published anchors) |
Edge |
| Space per unit |
4-6m2, corner-tolerant |
4-6m2/seat, wants rectangle |
Chair (geometry) |
| Throughput |
12-30 rides/day demand-limited |
60-90 rides/hr per row |
Simulator |
| Entry cost |
$6-12K unit band |
$18-28K open (karting published) |
Chair |
| Audience |
Impulse, siblings, parents |
Booked sessions, parties, leagues |
Depends on calendar |
| Margin profile |
Light cost lines, ~4.5mo payback |
49-55% margin, 6-9mo payback |
Chair (speed) / Row (scale) |
The archery lane - a published $12-20 per 15-minute single-seat simulator - is the useful control: it shows the simulator family's lower end, where a styled session earns more per guest than a chair but books less often. The edge column is the honest summary: two of five criteria favor each format outright, and the remaining three depend on the venue's own demand shape, which is why no verdict is forced here.
3. How It Works: The Sequenced Verdict With Its Basis Stated
The verdict, stated as sequence because the money says sequence: the chair is the lowest-risk purchase in the motion family - $6-12K at risk against a published $130-320 daily band and ~4.5-month payback - which makes it the demand test. When the counter data proves rides (12-30 daily sustained), the row converts proven demand into published throughput at 60-90 rides an hour; the karting guide shows the row's model holding $7.5-11K monthly at 49-55% margins. Buying the row first is the reverse bet: higher open cost before the demand case exists. Concrete scenario (EXAMPLE): a mid-size FEC opens two chairs ($20K installed frame), reads nine months of counter data, then commits $18-28K to the row its data defends - total exposure staged instead of lumped.
Where the Formats Sit in a Staged Motion Budget (EXAMPLE split, ~$38K staged plan)
- Two chairs (test) 26
- Simulator row (scale) 63
- Spares and content refresh 11
Source: worked scenario (EXAMPLE) - budget split of a staged single-seat plan: chairs first as the demand test, the row funded by proven data. Planning reference, not a quote.
Scenario Daily Gross per Unit (EXAMPLE planning frame)
Karting row seat-share
310
Chair (strong holiday)
320
Source: worked scenario (EXAMPLE) - non-monotonic planning frame across the published bands: chair daily mid-band, moto impulse scenario, row seat-share interpolated from karting monthlys, chair event ceiling. Published bands anchor each row.
The mix note the sequence implies: neither format excludes the other in operation - the 57% multi-activity preference (n=600, published) means the row anchor and the chair spillover compound, the pattern the published attraction-mix study prices at mall scale and the 500m2 density plan fits floor by floor.
4. Who It Is For and Where It Fits: Buyer Profiles and the Next Step
Who each format is for: the chair fits the cautious opener - the arcade testing VR (the published arcade profitability guide's reader), the mall concourse monetizing captive minutes, the FEC filling a corner its anchor cannot use. The row fits the committed operator - the party-calendar venue, the league builder, the floor whose data already proves demand. If the reader is both, that is the sequence argument again: be the first, then become the second.
Where it fits: run the five criteria against your own floor - the space guide's footprint math, the 50-square-meter count for chairs, the density plan for rows - and let the counter data, not the catalog, cast the deciding vote. Close the loop the practical way: stage the budget (the pie above), test with chairs, scale with the row, and re-run the per-machine calculator at each stage so every purchase order carries its own defended number.
The buyer's one-line brief: chairs test demand cheaply, simulators monetize it loudly - sequence them and the comparison stops being a choice and becomes a plan.
5. Frequently Asked Questions (FAQ)
Which is cheaper to open: a VR chair or a VR simulator?
The chair, decisively: the published unit band runs $6-12K against karting-simulator openings at $18-28K. Installed single-seat setups land around $7,500-14,500 in the cost guide's frame, while a simulator row's floor and support push the total higher. Cheaper is not the verdict, though - it is the entry ticket.
Which earns more per seat: chair or simulator?
Simulators, per published throughput: rows book 60-90 rides an hour across seats and karting publishes $7.5-11K monthly per row, while a chair earns inside the $130-320 daily band. But the simulator's higher earnings ride on higher cost lines - the 49-55% karting margin shows what survives after them.
Which format needs less space per unit?
Roughly the same published footprint - 4-6 square meters per seat in both families - but chairs tolerate awkward corners because each capsule is self-contained, while rows want a clean rectangle for circulation. The 50-square-meter chair count and the 500m2 density plan show both on real floors.
Which format handles party groups better?
Simulators, structurally: side-by-side seats ride together, which is the group experience parties buy. Chairs serve parties as the spillover and siblings option. If the party calendar is the business model, the row is the anchor and the chairs are the support cast.
Is the motion sickness profile different?
Yes, and it matters for family throughput: the chair's closed-capsule full-motion style is the more intense ride, while seated simulators tune motion to the content. The published motion-sickness guide covers the mitigations; the operational takeaway is queuing intensity, not avoiding motion.
So which should an FEC buy first?
The honest answer is sequence, not winner: chairs test the demand at minimum cash at risk ($6-12K), the simulator row monetizes proven demand at 60-90 rides an hour. The published arena-vs-simulator comparison reaches the same logic at anchor scale - buy the format your calendar can defend, then layer the other.
6. Featured NextPlay Active Gaming Equipment
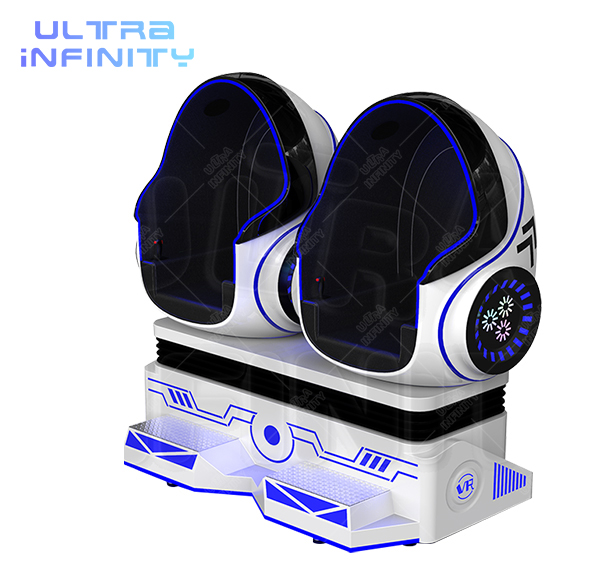
The demand test
VR Egg Chair
The published $6-12K, $130-320 per chair per day capsule - the lowest-risk entry in the motion family.
View Details ›
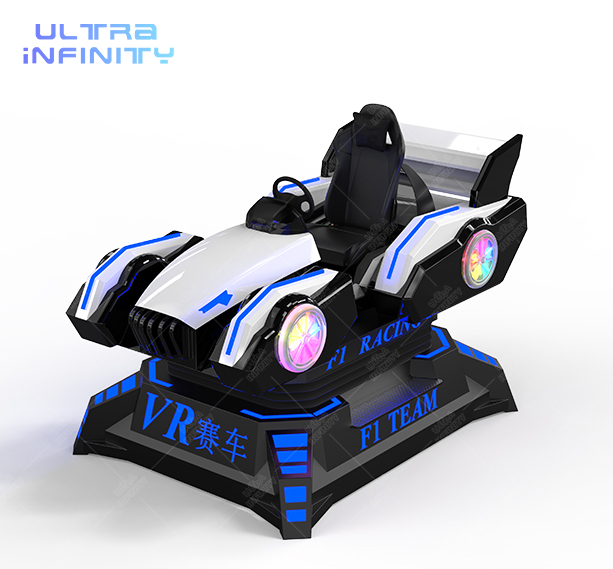
The throughput play
VR Racing Simulator - 2022 Best VR F1 Car Games Simulator
The seated-simulator family's face - the row format that converts proven demand into 60-90 rides an hour.
View Details ›
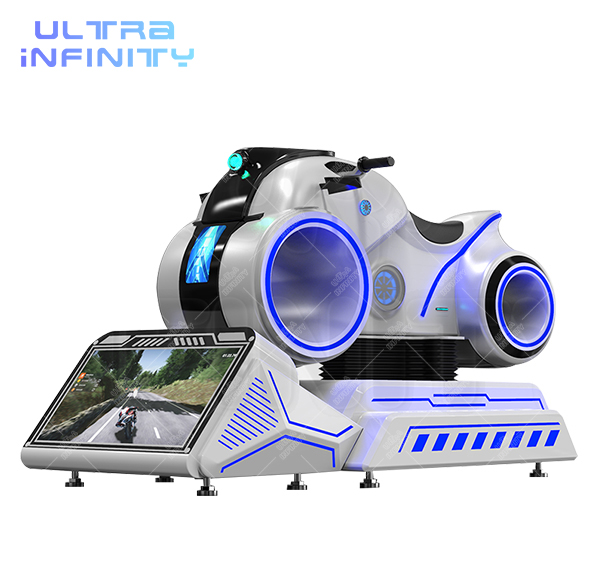
The middle case
VR Motorcycle Simulator
The styled impulse seat - the published 25-65 rides a day model between chair and row.
View Details ›

