MINI GOLF VS ARCADE - THE METERING LESSON, THE DENOMINATOR TRAP, AND THE TEST YOU CAN RUN TONIGHT
Mini Golf vs Arcade: Which Attraction Earns More per Square Meter?
Arcade cabinets are metered per play, mini golf per person, and neither side publishes the floor base the question needs. Here is what each side does publish, named, and the one evening test that settles it on your own data.
Four meters Denominator trap Per machine bounds Per hole bands One evening test
$200/wk
Published Per Game Target
$838-935/wk
Our Upper Bound Per Machine
1.5-2.6x
Cabinet vs Required Footprint
12-48 m2
Our Published Per Hole Band
1. The Short Answer: Nobody Publishes Both Halves of This Ratio
Every supplier in this category has told you their product earns more per square meter, and the reason you cannot decide from those claims is not that they lie. It is that the phrase per square meter is doing four different jobs at once, and the two attractions you are comparing are not even sold in the same unit. A cabinet is metered by the play. A course is metered by the person, or by the round, or by the hole once a technology layer is installed. One side of the ratio is cash per credit tap, the other is cash per ticket, and the denominator underneath them is measured from three different lines on a specification sheet.
So this page does the honest version of the job. It shows what each side actually publishes, with the publisher named, where the floor numbers come from and what they exclude, and then it hands you a test you can run on your own point of sale data in one evening, because that is the only comparison in this category with a denominator both sides agree on. What this page does not do is print a winner.
One finding up front, because it reframes the whole question. There is no public dataset that puts arcade revenue and mini golf revenue on the same floor area basis. The largest public operator in the arcade trade discloses revenue, game counts and store size, and it does not disclose how much of its floor the arcade occupies, so arcade revenue per square meter is not computable from filings at all. It is computable per machine and per store, and that is exactly where the honest numbers sit.
- The real question - not which number is bigger, but which unit your floor can actually bill in
- The trap - a per machine target and a per store average, divided by different floors, presented as one industry average
- The usable output - a four step test on your own data, with the denominator you choose written down
2. Four Meters on One Floor
Start with the billing instrument, because everything else follows from it. The FY2025 annual report of the largest US operator in this space, Dave and Buster's, states plainly that most of its games are activated by game play credits on cards or other radio frequency identification devices. That is the arcade meter: a credit, tapped against a machine, priced per play. The operator also discloses that the cost of entertainment as a percentage of entertainment revenues fell to 8.1 percent in fiscal 2025 from 8.5 percent, and gives the reason as lower redemptions following ticket payout adjustments and redemption center pricing changes. Read that sentence carefully, because it tells you the lever a cabinet operator pulls is a payout ratio, not a ticket price.
| Meter |
Who uses it |
What one unit of sale buys |
What caps the revenue |
| Credit per play |
Arcade cabinets, and the cashless systems that run them |
One cycle of one machine, typically 1 to 4 players on the published player counts |
Plays per machine per week, and no public source prints session length or plays per hour |
| Ticket or prize per play |
Redemption cabinets, where the machine is also a vending device |
A chance at prize stock, which the operator carries as inventory |
Prize cost, which is inside that disclosed 8.1 percent of entertainment revenue |
| Round per person |
Mini golf, the traditional meter |
A walk of the whole course, group paced |
Throughput of the route, which our capacity page models and this page does not |
| Hour per bay, or uplift per game |
Simulator bays, and interactive holes with a scoring layer |
Exclusive use of an instrument, or a premium on a round already sold |
Booked hours, and the technology uplift figure is a vendor ticketing claim, covered on our interactive pillar |
The consequence is arithmetic rather than opinion. You cannot divide one week of cabinet credits by the same floor you divide one week of round tickets by, and call both results revenue per square meter, unless you also agree what floor means and who is standing on it. Two people on one cabinet through a ninety second cycle and four people on one hole through a four minute round are not the same occupancy event, and neither of them is the same as one group holding a simulator bay for an hour. Our own comparison of a course against a different neighbour, on a denominator we did agree, is the mini golf versus bowling per square meter page, and the arcade versus a laser arena is the laser CS versus arcade per square meter page. Both of those use one method; this page is about why the arcade versus mini golf pair cannot.
3. What the Arcade Side Publishes, and What It Refuses To
The arcade trade publishes per machine numbers and hides per square meter numbers, and it is worth seeing both halves in the same table. On the published side there is an association distributed target, a per machine figure from a public filing, and store level averages. On the unpublished side there is session length, plays per hour, and the share of the floor the arcade occupies.
| Published arcade number |
Value as printed |
Who published it |
What it cannot be used for |
| Per game weekly target |
At least 200 US dollars per game per week, at which rate most machines pay for themselves within 12 to 18 months |
An IAAPA news feature interview with a redemption distributor merchandising manager, December 2025 |
It is a target set by a party selling machines, not a measured average, so it cannot be averaged with anything |
| Entertainment revenue per store and per machine |
Entertainment revenue of 1,323.5 million dollars, 62.9 percent of total revenue, and an average of about 125 games per Dave and Buster's store and 112 per Main Event store, and a comparable store base of 153 Dave and Buster's plus 57 Main Event stores. The estate itself is larger: 179 Dave and Buster's branded stores, 243 venues owned and operated in North America |
FY2025 Form 10-K, fiscal year ended 2026-02-03 |
The numerator also carries bowling, laser tag, billiards and the arcade game business, so per machine revenue is an upper bound |
| Store floor area, by brand |
Dave and Buster's stores average 37,000 square feet and range from 16,000 to 70,000; Main Event stores average 53,000 square feet and range from 37,500 to 78,000 |
The same filing |
Neither average is an estate figure, each belongs to one brand, and both are the whole building including restaurant and back of house rather than arcade floor |
| Reinvestment rate |
5 to 10 percent annually into new titles |
The same association feature |
A practitioner recommendation, not an accounting policy |
| Machine mix of a high performing arcade |
About 65 to 70 percent redemption, 15 to 20 percent video, 10 to 20 percent instant win merchandisers |
The same association feature |
The article never says whether those percentages count machines or revenue, so do not treat either reading as settled |
Now the arithmetic we did, so you can see where the honest ceiling sits. Take the disclosed entertainment revenue, 1,323.5 million dollars, and divide it by the disclosed machine population, 243 company owned stores carrying an average of 112 to 125 games, which gives roughly 27,200 to 30,400 machines. That lands at about 43,600 to 48,600 dollars per machine per year, or 838 to 935 dollars per machine per week. It is an upper bound by construction, because the numerator includes every entertainment line in the building and not just cabinets, and it must never be blended with the 200 dollar target from a machine seller. Two numbers four times apart, both defensible, both about a cabinet, and neither of them about a square meter.
Try the same filing for the per square meter question and it stops you cold. A Dave and Buster's store averages 37,000 square feet against that brand's own average of about 125 games, which gives 296 square feet of building per machine, and that figure is meaningless as an arcade footprint because it quietly charges each cabinet with its share of the kitchen, the bar, the restrooms and the prize counter. The operator does say where it is going: it reports having reduced the back of house space and optimized the customer facing area dedicated to simulation and redemption games. That is a strategy disclosure, not a floor plan, and it is the closest this category gets to the number the question asks for.
Snapshot basis: all arcade figures above were captured 2026-09-21 as raw/mini-golf/2026-09-21-dave-buster-fy2025-10k and 2026-09-21-iaapa-revenue-operations-building-arcade, with body text hashes recorded. The 10-K needed a compliant filing-portal user agent; a generic browser agent returns 403, which is why an unverified screenshot is worth less than a saved document.
4. The Denominator Problem: Cabinet, Required Footprint, Route
Here is the part that decides the argument and almost nobody checks. Suppliers print floor area on at least three different bases, and the difference between them is larger than the difference between the two attractions.
- Cabinet only - arcade machine makers publish master dimensions of the box, for example 32.5 by 46 by 120 inches on one published strength tester upright, and a kiddie ride at 95 by 165 centimeters, with no approach or queue distance printed at all
- Cabinet plus required space - motion cabinet suppliers publish a second, larger block, and the gap is the story: one arcade title prints a cabinet at 94 inches wide by 104 inches deep and a recommended minimum floor space of 96 inches by 148 inches, while a racing cabinet manual prints a cabinet at 4 feet 9 inches by 9 feet 11 inches and a single setup minimum of 8 feet 1 inch by 15 feet 3 and a half inches
- Route plus approach - mini golf publishes neither a box nor a queue, it publishes a planning allowance per hole, which is why the two sides do not line up on a drawing
Floor per unit in square meters, by the base each source actually printed (our arithmetic on published dimensions)
Kiddie ride, cabinet only
1.6 m2
Racing cabinet, cabinet only
4.4 m2
Our Cyclone Spin module sheet
6.4 m2
Four player arcade cabinet, cabinet only
6.3 m2
Arcade cabinet, recommended minimum floor
9.2 m2
Our Gate Challenge module sheet
10.8 m2
Racing cabinet, recommended minimum floor
11.5 m2
Our beginner tier planning hole, low end
12.0 m2
Bar length is scaled to the largest value shown. Rows are not comparable as claims; they are comparable as evidence that a cabinet is not its footprint. The racing manual prints 11.5 square meters of required space against 4.4 of cabinet, which is 2.6 times, and the arcade title prints 9.2 against 6.3, which is 1.5 times. Our own two module sheets print equipment boxes, not routes, and our planning band for hole footprint runs 12 to 48 square meters with the walking route counted on top of it at about 1.5 to 2 times that footprint, which puts it off the top of this chart by design.
The regulatory layer makes the gap physical rather than commercial. The 2010 design standards require a clear floor or ground space of 30 inches by 48 inches minimum at a use element, a clear width of 36 inches minimum on walking surfaces, a 60 inch turning space, and they state expressly that queues and waiting lines comply with the same provisions. That is why the depth on a cabinet specification grows by more than a meter while the width barely moves: the extra is where a person stands and where a line forms.
Mini golf has its own version of the same rule, and it eats hole design rather than aisle width. The Access Board guide to miniature golf requires that at least 50 percent of the holes on a course be accessible, and that the accessible route on a playing surface be within 36 inches of any area where the ball comes to rest, with a minimum route width of 36 inches and a slope no steeper than 1 to 12. Read that as a design constraint and it says: the reachable half of your course cannot be laid out where the ball can stop far from a path. That is a floor area cost, it belongs to the course and not the cabinets, and it is the kind of line that turns a paper layout into an expensive field change.
If you are handed a per square meter claim, ask which line it used: the box, the box plus standing space, the route plus approach, or the building. Four legitimate answers, and they differ by more than the two attractions do.
5. What the Course Side Publishes, and Where It Lands
Specialist course builders publish area per eighteen holes rather than per hole, which is the opposite convention to a cabinet sheet and a third reason the two sides cannot be laid end to end. Two builders print the same indoor band, 2,500 to 10,000 square feet, and both print an average of 6,500 square feet for an eighteen hole indoor course. Converted to a per hole allowance, which is our arithmetic and not their claim, that band is roughly 12.9 to 51.6 square meters per hole, with the stated average landing at about 33.6 square meters per hole.
Put that beside our own published planning band and the cross check is not as clean as it looks, because the two sides measure different things. Our course material publishes 12 to 48 square meters per hole as floor footprint, split by difficulty tier at 12 to 25 for beginner, 20 to 36 for intermediate and 30 to 48 for advanced, and our own cost page then puts the working area per hole at about 1.5 to 2 times that footprint once the walking route is added. The builders' implied band of roughly 12.9 to 51.6 square meters per hole is a route inclusive allowance, so it is the number our holes land against only after the multiplier, not before it. On footprint alone the smallest object on this comparison is still a cabinet rather than a hole, since our beginner tier starts at 12 square meters and three of the arcade boxes above it are smaller; on working area a flagship hole is the most expensive object on either side of this comparison. That distinction is the whole reason this article prints both and refuses to average them, and it carries a second lesson: two conventions can agree about floor and still say nothing about revenue.
| Course side figure |
As published |
Publisher |
How to treat it |
| Indoor area for 18 holes |
2,500 to 10,000 square feet, with 6,500 square feet given as an indoor average |
Two specialist course builders, the same band circulating between them |
A planning band, and one figure rather than two measurements |
| Throughput of a full course |
A typical 18 hole course can handle 90 to 100 people per hour |
One of the same builders, no method printed, and the unit is people rather than rounds |
The only published course throughput we could find anywhere, and it carries no group size or rounds assumption |
| Staffing of a course |
One or two staff members to run the counter, hand out clubs and collect balls |
The same builder page |
A vendor sentence about their own product, useful as a range to test, not a labor standard |
| Surface installation |
Putting lanes quoted at 95 to 140 and indoor courses at 45 to 85 per square meter, in GBP, under a column headed Typical From Price |
A UK turf installer |
Surface and install only, one currency, one company, and not a course price |
| Our own module footprints |
4.0 by 1.6 meters on one sheet, 2.4 by 4.5 meters on another, both 100 W at 220 V 50 Hz and 1 to 3 people |
Our live product sheets, re-read 2026-09-21 |
Equipment boxes, and only two holes in the whole range publish even that |
The consumables line is worth one paragraph because it is the closest this category gets to an operating cost both sides share. A course construction package lists 600 square yards of carpet, 120 urethane headed putters and 20 dozen assorted colored golf balls among its contents. Those are quantities included in a build, not replacement rates, and no service interval is printed with them. A cabinet manual does name its wear part, telling the operator to replace the bellows when a fault appears, and a bill acceptor manual gives a cleaning checklist with no rated life at all. On both sides of this comparison, the wear schedule is something you will write yourself, because nobody publishes one.
6. Two Cost Lines That Look Comparable and Are Not
Power first, because operators compare it constantly and compare it wrongly. Cabinet documentation publishes current at voltage, which is a circuit sizing number, not energy: a four player arcade title lists 120 volts at 60 hertz and 5 amps, a racing cabinet lists 20 amps operating with 10 amps per inlet and recommends a dedicated breaker, and a strength tester upright lists 6 amps. The only component in this whole evidence set that publishes an average rather than a peak is the payment device, which states 0.2 amps at standby and 2.5 amps operating. That single ratio is the argument: nameplate amps multiplied by opening hours overstates energy by a large and machine specific factor, because a cabinet sits idle most of the day. Our own mini golf modules publish 100 W on the two sheets that publish anything at all.
Fixed per machine costs second, and only as a pointer. Several US states license coin operated and amusement machines per device rather than per venue, which means a cabinet count is a tax line in some markets and a course is not a taxable machine at all. Those schedules are jurisdiction specific, they change annually, and they are covered with dated sources on our US opening cost page rather than summarized here. If you are comparing a 30 cabinet plan against a 9 hole course in Texas or Florida, the per device lines are real and they are not in any supplier's revenue per square meter claim.
Energy and licensing are deliberately left as ranges and pointers rather than numbers on this page. A per machine annual fee is a jurisdiction and a date, and an energy comparison requires a duty cycle that no supplier in either category publishes.
7. The Test You Can Run on Your Own Floor in One Evening
Since nobody publishes the ratio you asked for, here is how to compute it on your own floor with data you already have. This is the only version of the comparison that will survive a landlord, a partner or your own accountant, because every input is yours.
- Pick one attraction, one closed week, and one floor number, and write down which base that floor number is: cabinet only, cabinet plus standing and queue space, or route plus approach. If you cannot say, stop here and measure it on the plan.
- Pull revenue for that attraction alone from the point of sale or the cashless backend, not from the venue total, and pull it in the unit the attraction is actually metered in, which for cabinets is plays or credits and for a course is rounds or tickets.
- Divide revenue by your chosen floor area to get the yield, and divide it by available hours to get the utilization, which is the number that tells you whether the constraint is the floor or the calendar. A low yield with high utilization is a floor problem. A low yield with low utilization is a demand problem, and no amount of reslotting fixes it.
- Repeat for the second attraction on the same week and the same floor base, and only then compare. If the two weeks are not the same season, you are comparing a January cabinet to a September bay.
Assumptions behind that test, stated so you can disagree with them: one attraction earns revenue in more than one line, since a cabinet drives prize redemptions and a course drives food and beverage, and a single revenue divided by a single floor will always under-count the attraction that sells the visit. Where the two numbers disagree, the mechanism matters more than the yield: our own revenue per square meter method page carries the mechanism, the concourse yield page carries the traffic side, and the multi-attraction versus arcade earnings page carries why a single format floor under-reads the mix.
Limitations to print in your own version of the sheet: a single week is one week, cabinet revenue is bundled in a card system that does not always attribute cleanly to one machine, a course in a mall is subsidized by foot traffic it did not pay for, and every figure in this article that came from a supplier was published by a party selling the thing it measures.
The deliverable is not a number. It is a sheet with two attractions, one stated floor base, one stated week, and the utilization line next to the yield line so nobody can quote you the wrong half.
8. Which One Fits By Situation
Below is the decision as four floors, with the reason attached so you can argue with it. The reason is always a meter or a denominator, never a headline yield.
| Your floor and your trade |
The attraction that fits |
The reason |
| Mall concourse, high walk in traffic, mostly families and kids |
Arcade and redemption banks |
The credit meter converts passing traffic into small tickets without a route, a queue line or an attendant per hole |
| A dead corner of your floor you cannot sell to a tenant |
A 9 hole course |
A route activates a corner a cabinet cannot, because the walk is the product, and the fit checklist lives on our adding a hole to an arcade page |
| Bar, social club or late night floor |
Neither, in the classic form |
Adult evenings are a scoring and session question, so read the interactive hole pillar and the compact formats page first |
| Existing arcade with a machine refresh budget |
Both, in that order |
Reinvestment of 5 to 10 percent annually into titles is the arcade's own published maintenance habit, and one themed hole is a different kind of capital line, so put them in different years |
The row worth pausing on is the third one. The question people bring us as mini golf versus arcade is very often really a question about an evening trade that neither a redemption bank nor a family putting course serves on its own, and that is a technology and programming decision rather than a floor area decision. Our own versus page on the other golf purchase, golf simulator versus mini golf, handles the case where the adult customer is the one you are chasing.
9. What This Page Does Not Restate
The deliberate omissions, so nothing here is mistaken for a business case. No course cost, per hole cost, ticket price, capacity per hour, payback or revenue per square meter figure from our own models appears in this article. Those numbers belong to the pages that own them, the course cost breakdown, the cost, space and profit hub, the ROI method, the payback timeline, the space planning bands and the capacity model, each linked with its assumptions printed on its own page, and importing them into a versus article is how you end up averaging two models that disagree about what a square meter is.
No arcade revenue figure here is presented as an industry average. The per game weekly target is published by a party that sells machines, the per machine annual figure is our own division of a public operator's consolidated entertainment revenue across its disclosed machine count, and the two differ by roughly a factor of four because they measure different things. Where a source published nothing, this page says so rather than filling the gap: no supplier in either category printed session length, plays per hour, a wear interval, or the arcade share of venue floor.
Two areas sit outside this comparison entirely. Accessibility compliance and fire load in your building are jurisdiction specific and belong to a licensed professional with your drawings, not to an article that quotes the federal minimums as orientation. And what a guest actually experiences, why a route feels longer or shorter than it is and which hole to design for which age, is the consumer facing side of our venue revenue and interactive golf material. Take this page as the metering lesson, then run the evening test on your own numbers.
10. Mini Golf vs Arcade FAQ
The questions that decide the purchase, answered with named publishers, our own published sheets, and the gaps labelled as gaps.
Does mini golf or arcade earn more per square meter?
Nobody publishes both sides on the same basis, so any single answer is a model rather than a measurement. What is published: a target of at least 200 US dollars per game per week from a redemption distributor speaking to an industry publication, and, from a public operator's FY2025 annual report, entertainment revenue of 1,323.5 million dollars across an average of 112 to 125 games per store by brand, which we divide to an upper bound of roughly 838 to 935 dollars per machine per week. Neither is a per square meter figure, and the operator never discloses how much of its floor the arcade occupies, so arcade revenue per square meter is not computable from filings at all.
Why can't I compare a cabinet's square meters with a hole's?
Because the two are printed on different bases. Cabinet suppliers publish either the box alone, with no approach, or the box plus a recommended minimum floor space that is 1.5 to 2.6 times larger, and mini golf publishes a hole footprint band with the walking route added on top of it, or in the case of the specialist builders an allowance per hole that already has the route inside it. Add the accessibility layer, which requires 30 by 48 inches of clear floor at a use element, 36 inch minimum walking widths, and treats queues as in scope, and the honest spread between a machine's footprint and its real floor demand is larger than the gap between the two attractions.
How much floor does a mini golf hole actually need?
Our published band is 12 to 48 square meters of hole footprint, tiered at 12 to 25 beginner, 20 to 36 intermediate and 30 to 48 advanced, and our own cost page adds the walking route on top at about 1.5 to 2 times the footprint. Two specialist builders publish an indoor band of 2,500 to 10,000 square feet per 18 holes, which converts to about 12.9 to 51.6 square meters per hole with the route already inside it, with a stated average of 6,500 square feet, or about 33.6 square meters per hole. Our two module sheets that publish dimensions at all print equipment boxes of 4.0 by 1.6 meters and 2.4 by 4.5 meters, which are the objects, not the routes.
How many people can an arcade cabinet or a mini golf hole serve per hour?
The arcade side publishes players per cycle, one to four on the sheets we read, and no session length, plays per hour or cycles per day, so a per hour figure cannot be built from supplier data. On the course side the only published throughput we could find is a builder statement that a typical 18 hole course can handle 90 to 100 people per hour, with no printed method and with people rather than rounds as the unit. Our own players per hour model, including why hole occupancy rather than foot traffic sets the ceiling, is on the capacity and players per hour page and is not restated here.
Is a course cheaper to staff than an arcade?
The only published statement we found is a builder claim of one or two staff members to run the counter, hand out clubs and collect balls, which is a vendor sentence about a vendor product. Cabinet supervision is closer to unattended, which is why the arcade labor model is a shift question rather than an attraction question; our staffing per shift page carries that arithmetic and the queue and evening structure that goes with it.
What recurring cost is different between them?
Two lines. Reinvestment: an industry feature recommends putting 5 to 10 percent back into new titles annually, which is a cabinet specific refresh habit with no equivalent on a course, where the named consumables are surface, carpet, putters and balls, published as quantities in a build package rather than as replacement rates. Licensing: several US states tax coin operated and amusement machines per device, which makes machine count a fixed cost line for an arcade and not for a course.
Which one should I actually buy?
Whichever meter matches how your floor already gets paid. If your revenue arrives as thousands of small taps from passing traffic, that is a credit business and cabinets suit it. If it arrives as tickets from groups who came for the visit, that is a round business and a route suits it. Then run the one evening test on this page against your own point of sale data, on a floor base you have written down, and let utilization and yield sit next to each other before you spend anything.
11. Featured NextPlay Active Gaming Equipment
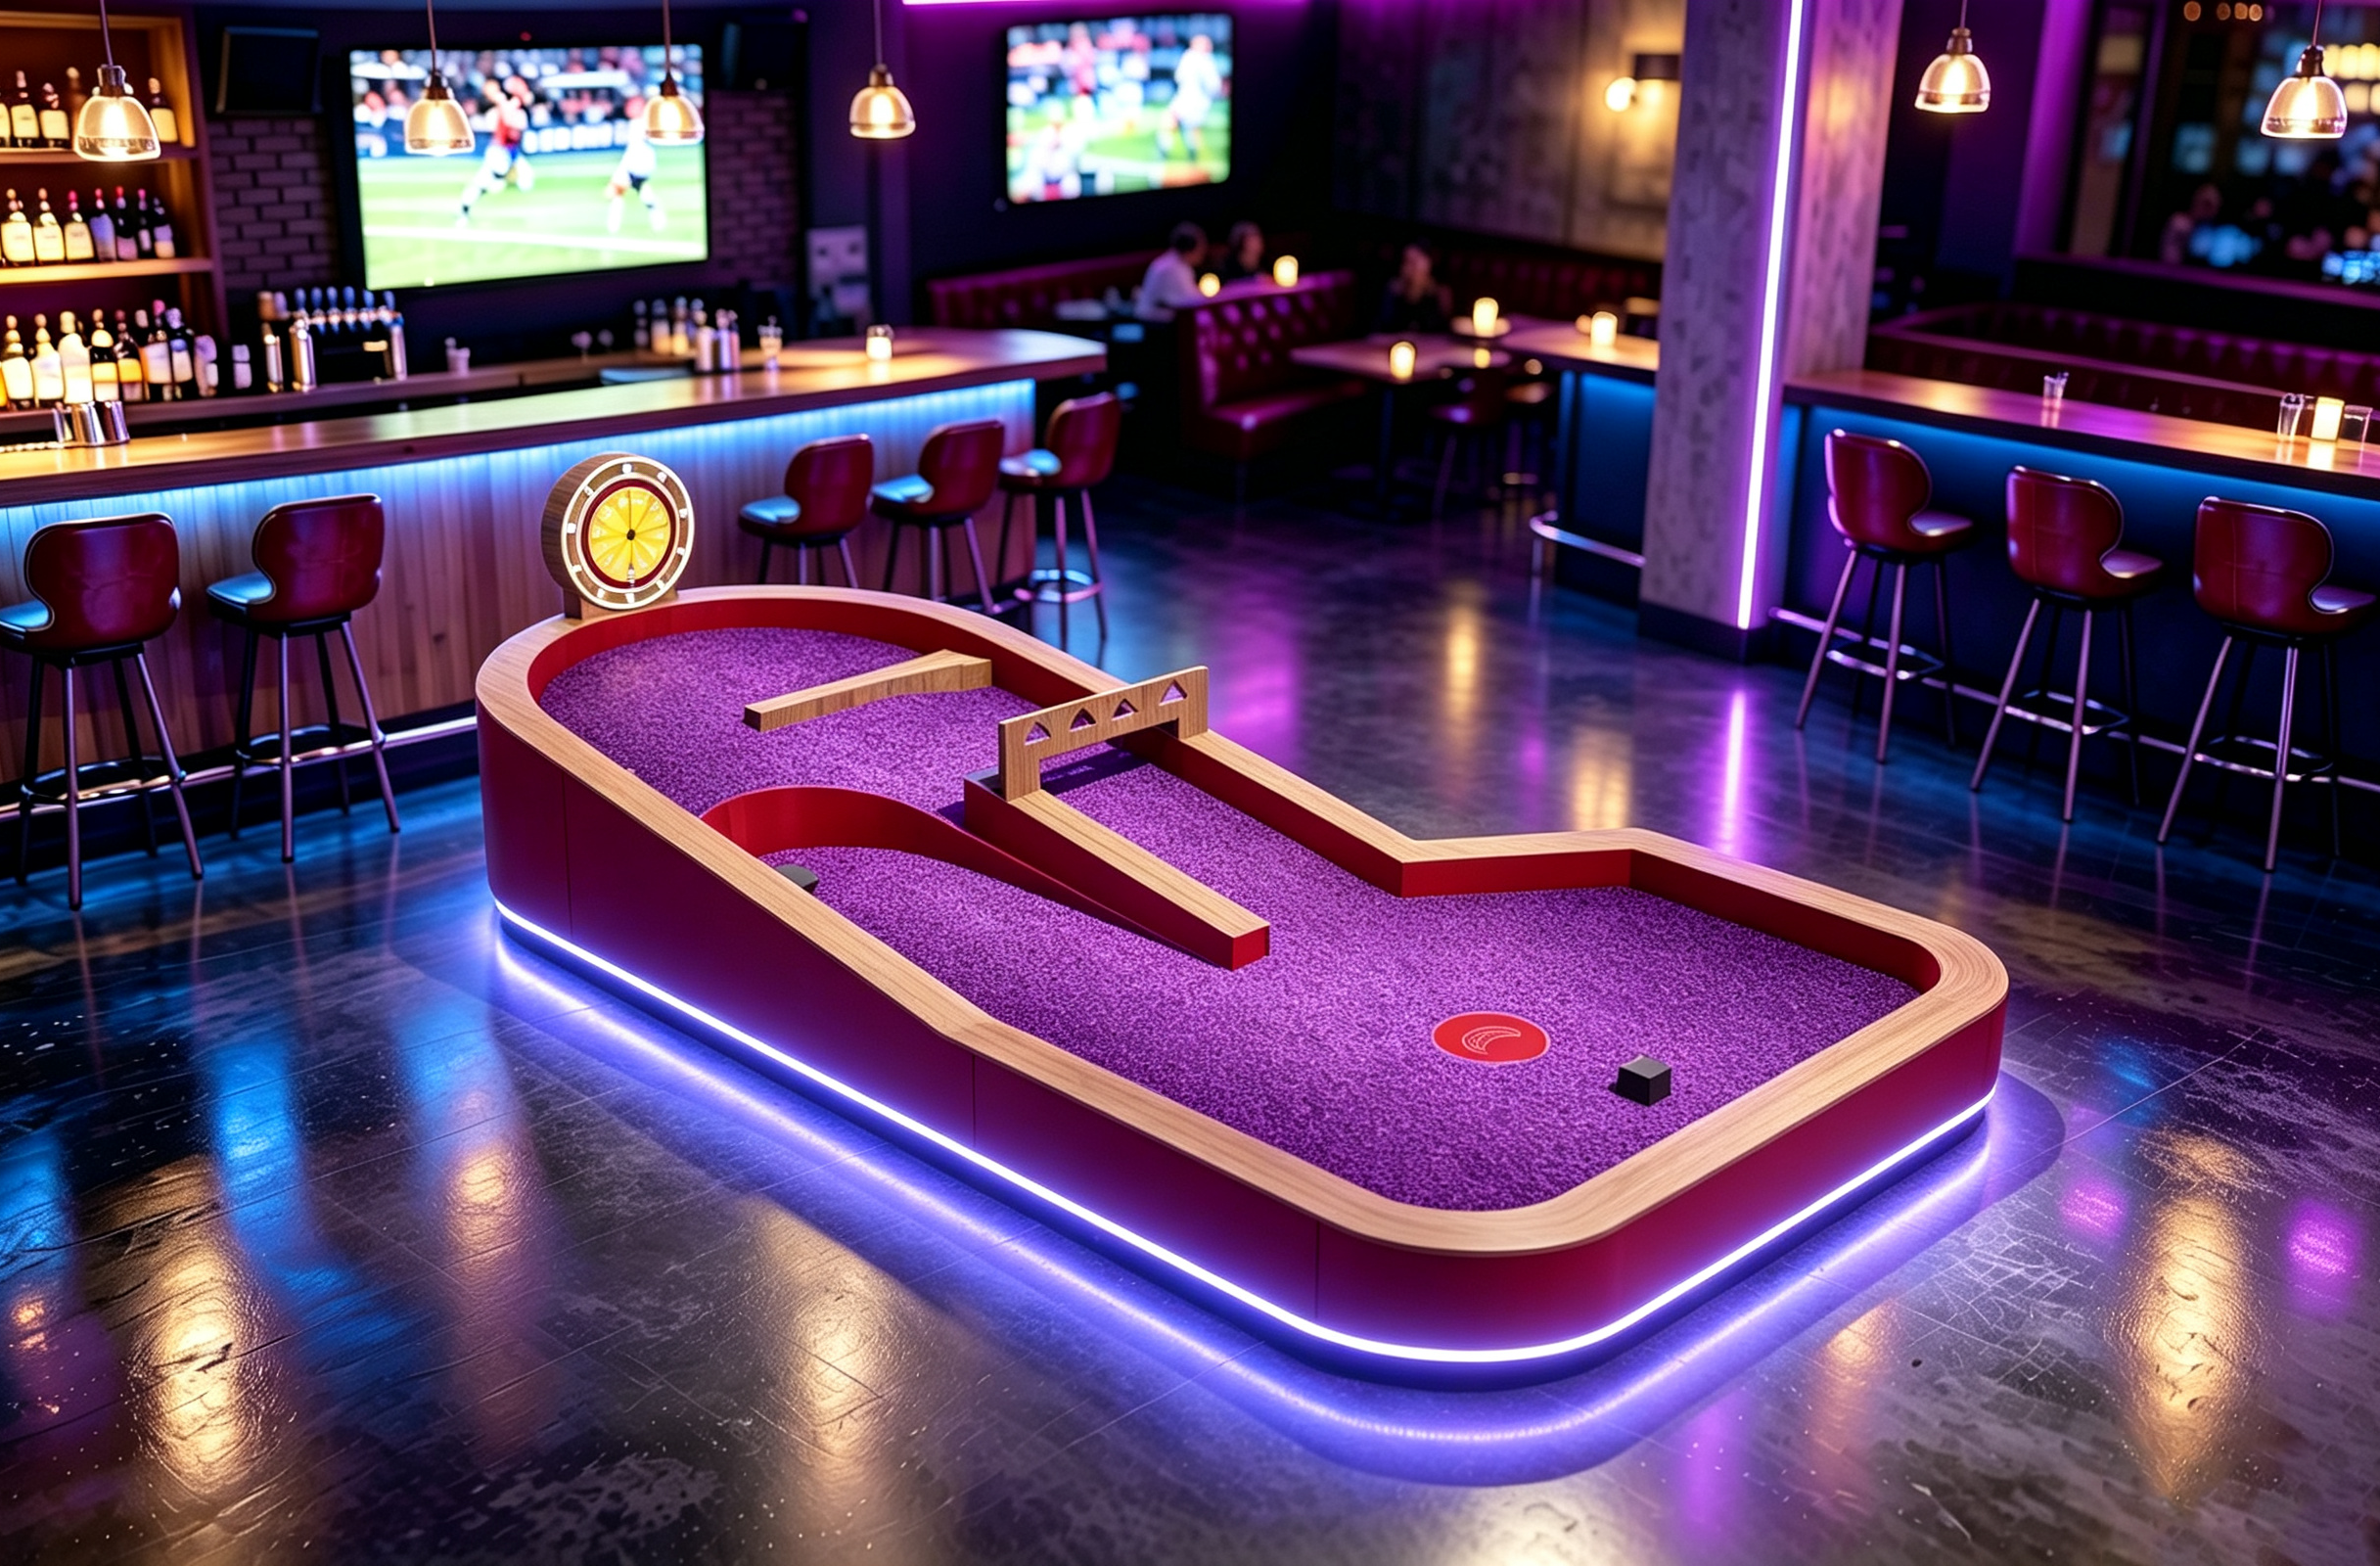
The specced route object: 2.4 by 4.5 m of floor, 100 W, 1 to 3 people
Gate Challenge Golf Hole, Indoor Mini Golf Hole
One of only two holes in our commercial range that publishes a technical specification, and the numbers are the honest kind: 2.4 by 4.5 by 1.0 meters, 260 kilograms net, 100 W at 220 volts 50 hertz, one to three people, a 4.5 meter fairway, and twenty balls with one putter in the accessories line. It is the most useful object in an arcade versus course discussion because it is small enough to sit where a cabinet sits and still be a hole rather than a machine, with no ticket payout, no prize stock and no title to license. The sheet prints no price and no service interval, and neither does any cabinet page we read.
View Details ›
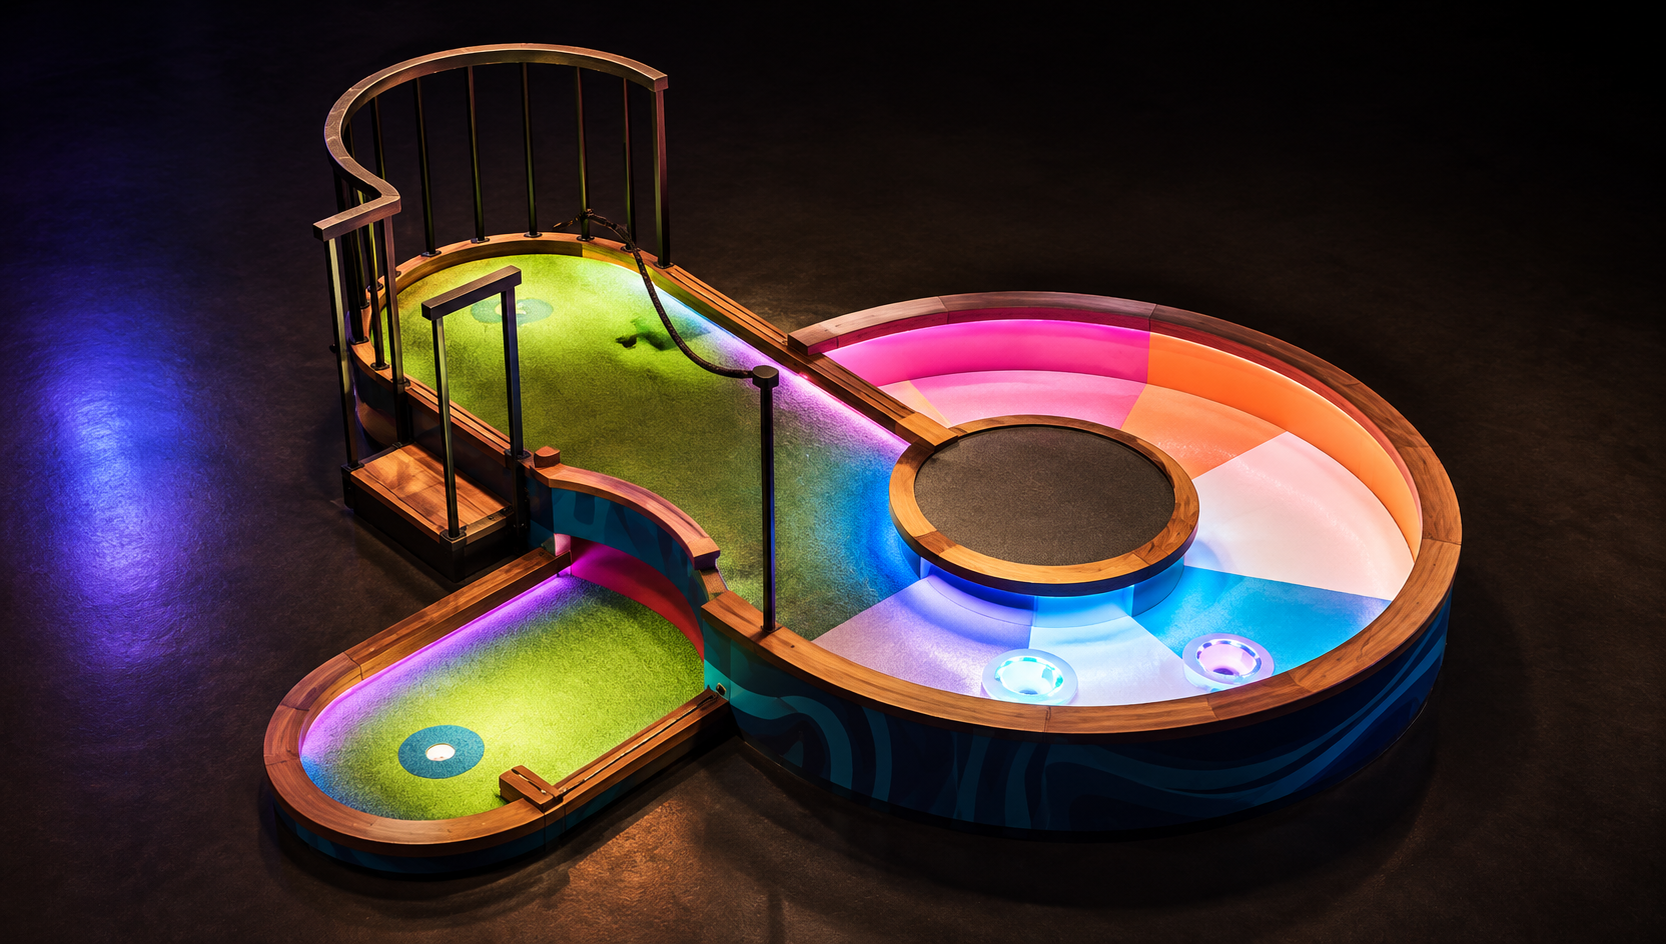
The compact footprint with a real spec block: 4.0 x 1.6 m, 280 kg net
Cyclone Spin Hole, 360 Degree Loop Ramp Mini Golf
The second module in the range with published dimensions: 4.0 by 1.6 by 1.8 meters, 280 kilograms net, 100 W at 220 volts 50 hertz, one to three people, and key play areas given as a ball placement area, a 360 degree loop track and a central target zone, shipped with twenty balls and a putter. Beside the cabinet numbers on this page it does the work the comparison needs, because 6.4 square meters of equipment floor sits in the same band as a racing cabinet printed at 4.4 square meters of cabinet and a four player title printed at 6.3, while remaining a hole you thread into a route.
View Details ›
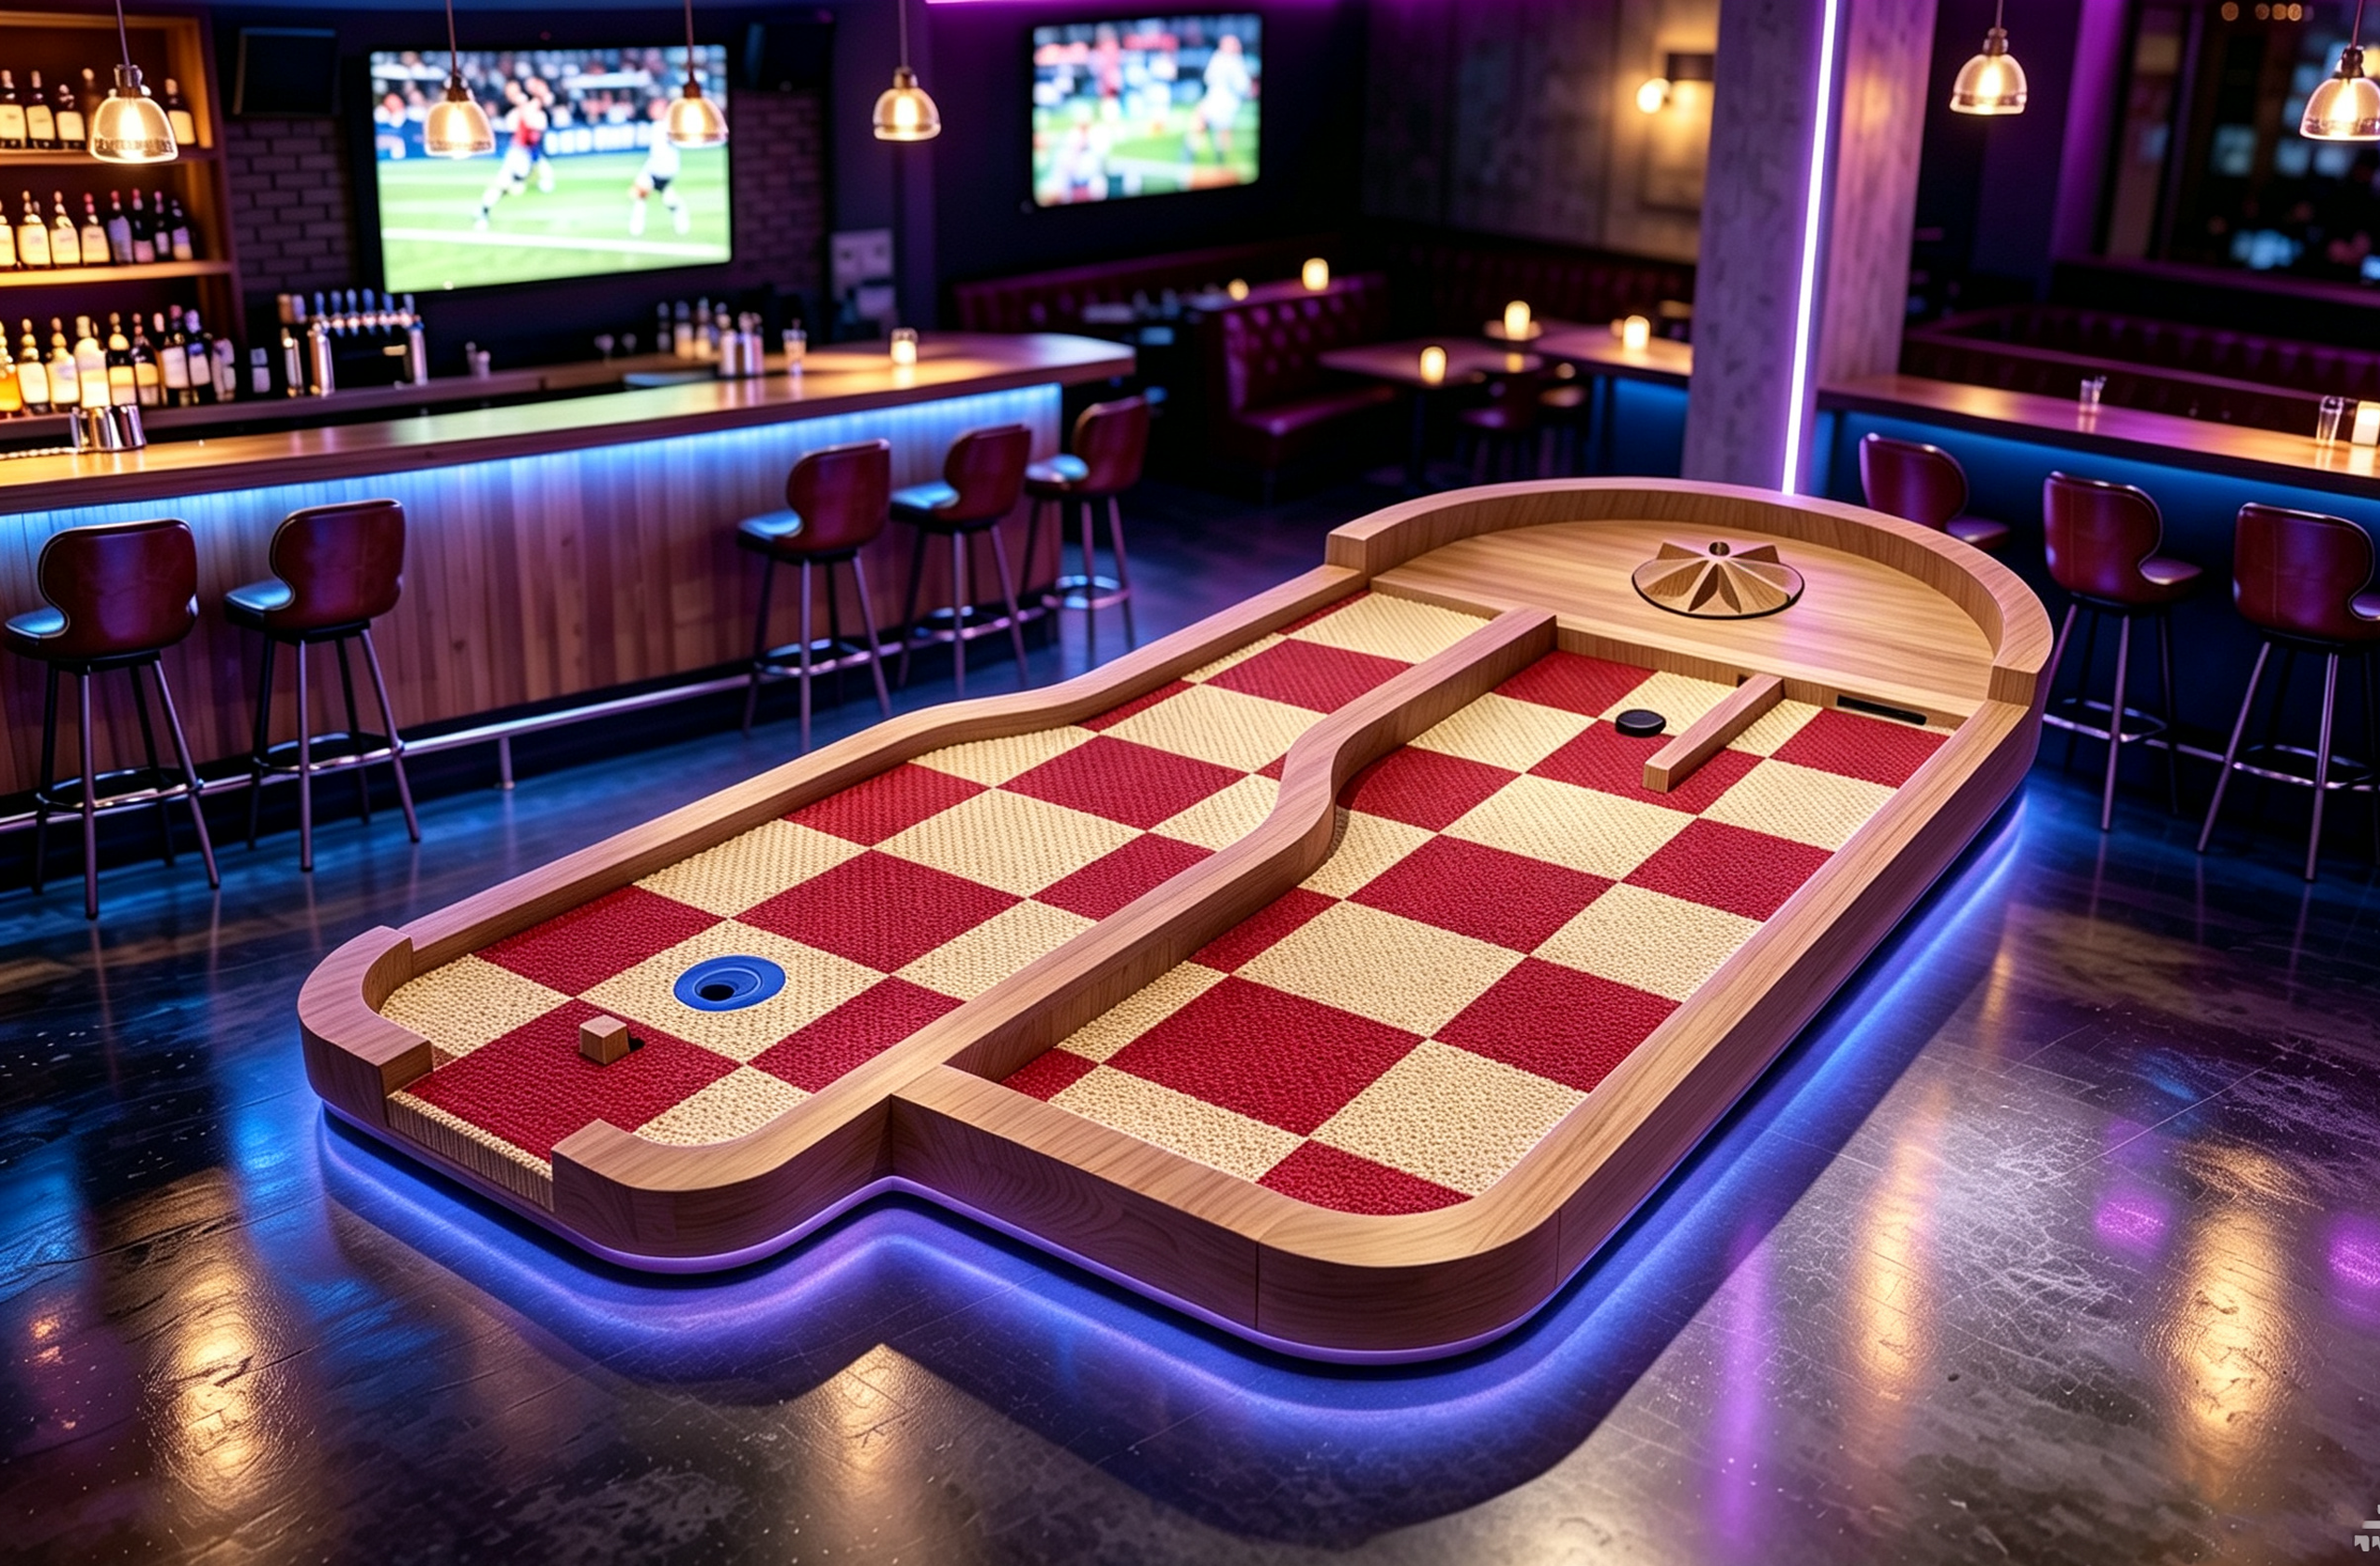
The themed lane: what a route buys that a bank of cabinets cannot
Lucky Disc Golf Hole, Indoor Mini Golf Hole
A disc golf shaped themed hole carrying a three of five star difficulty rating and a written description on its page. A re-read of all eighteen commercial hole pages on 2026-09-21 found seventeen that print a difficulty star rating, only two that print a specification table, and not one that prints a price. That is the honest read on the course side of this comparison: the design signal exists on almost every page and is vendor assigned, while the floor, power and head count numbers exist on two pages out of eighteen, which is exactly the gap an arcade specification sheet fills and a route fills with walking space instead.
View Details ›

