VR ARCADE COST IN THE USA - WHAT YOUR ADDRESS DECIDES AND WHAT IT DOES NOT
How Much Does It Cost to Open a VR Arcade in the USA? The 2026 Market-by-Market Guide
VR arcade equipment costs the same in every US state. The room does not. This guide splits the American opening budget into three layers - rent and build-out, wages and payroll burden, and the taxes, licences and accessibility rules a state or county puts on your machines - then prices one floor plan at six addresses.
Equipment is national, the room is local Place: rent and build-out People: wages and burden Paper: taxes, licences, ADA Three metros, six addresses, one room What this guide cannot tell you
1. The Equipment Line Is The Part That Does Not Move
Start from the half of the budget that has an answer, because it is the half most guides spend their words on. A venue-grade VR simulator chair sits at USD 6,000 to USD 12,000 and up (how much a VR chair costs). A free-roam arena build runs from roughly USD 28,000 for a four-player setup to about USD 85,000 for an eight-player system with headsets, backpack computers, tracking and the base infrastructure around them (what a 2026 VR arcade setup really costs). Those numbers are the same whether the venue opens in Ohio or in coastal California, because a machine built in Shenzhen and cleared at Los Angeles does not know which city it is going to.
What the machine does not include is the address. The invoice price is one of five cost blocks in a US opening, and the other four are decided in a different conversation: with a landlord, with a county assessor, with a state labour department and with an insurance broker. A reader who budgeted the equipment line and nothing else has not built a cheap venue, they have built an unbudgeted one. The budget walk published on this site counts four layers rather than five, and the two frames are not in conflict: its four are the equipment invoice, getting the room ready to run, the operating consumables and the revenue the stack must clear, which folds the five blocks in this article into four by merging the address into the second and third (how to budget commercial VR equipment). Only the first layer is portable across state lines, which is also why this guide does not end in a single US total. One number for a VR arcade in America would be an average of markets that differ by a factor of three inside one metro and by more than that between product classes, and the closing section sets out exactly what the three layers below can answer and what they cannot.
Freight, duty and the delivery term belong to the equipment layer too, and they behave the same way. The document audit guide carries the arithmetic: a single-seat crate moves about 8.4 CBM, less-than-container-load rates on the China to US lane run USD 40 to USD 60 per CBM, a 40 foot high cube on the China to US West Coast lane averaged USD 2,800 to USD 3,600 in late 2025 with spot lows near USD 1,900 to USD 2,600, and a USD 16,800 machine lands somewhere between USD 22,400 and USD 25,800 once duty, port charges and on-site work are counted (what a VR arcade equipment quote includes). None of those lines has a state column, and the West Coast band is not an East Coast band either. The rent under them, the payroll above them and the taxes around them all do.
| Cost block |
Who sets it |
Does it vary by US market? |
Where the detail lives |
| Equipment, freight, duty, install |
The factory and the shipping lane |
No, within normal rate movement |
The quote document audit and the landed-cost walk |
| Rent, common area maintenance, build-out |
The landlord and the county |
Yes, and the spread is inside the metro as much as between metros |
This guide, layer one |
| Wages, scheduling, payroll taxes |
The metro labour market and two levels of government |
Yes, and on two lines at once |
This guide, layer two |
| Taxes and licences on receipts and on the machines |
The state and the county |
Yes, and some states tax equipment you already paid for |
This guide, layer three |
| Compliance and insurance |
Federal accessibility law plus the landlord and the carrier |
Partly: the rule is federal, the cost is local |
This guide, layer three |
That table is the shape of the whole article. One row is settled. Four rows are not, and the three metros this guide reads line by line - Phoenix, Atlanta and Manhattan - answer them differently for the identical machine count and the identical floor plan. The surprise is where the difference is not: on one publisher, one quarter and one net basis, Phoenix and Atlanta sit 92 cents per square foot apart on asking rent. The location load is not a metro ranking. It is the submarket you pick inside the metro, the wages the metro prints, and the paper the state puts on your machines.
Source basis: the hardware and landed-cost figures in this section are republished from three already-published guides on this site, which carry their own sourcing. They are repeated here only to establish which cost blocks are national, not re-derived.
2. What Your Address Has To Deliver Physically
Before any rent number means anything, it has to describe a room that can hold the product. US listings quote square feet and clear height in feet; our specification sheets quote metres, and the mismatch is where buyers lose a shortlisted property. Here is the conversion exercise done once, using the published site-readiness work (what ceiling and power 360 VR chairs need) and the live product parameters we re-read from our own product pages on 2026-09-20.
Clear height is the first filter. A rotating 360 chair needs at least 3.6 m from the finished floor to the lowest duct, which is about 11 ft 10 in, and the recommended band is 3.8 to 4.2 m or roughly 12 ft 6 in to 13 ft 9 in (what ceiling and power 360 VR chairs need). US listings quote clear height under the beam, which is the wrong line: the number that decides whether your machine fits is measured to the lowest duct, sprinkler or light fixture, and a listing that quotes the beam does not prove either way. Free-roam arenas are less demanding vertically and more demanding horizontally: our four-player standing platform system needs no unusual ceiling, while the walking arena needs an unobstructed square.
Floor plate is the second filter, and this is where a US square-footage conversation goes wrong in a way that costs money. The play areas below are the arena 2.0 specification sheet as we re-read it on 2026-09-20: a four-player build at 8 by 8 m, which is 64 square metres or about 690 square feet; six players at 10 by 10 m, about 1,075 square feet; eight or ten players at 10 by 15 m, about 1,615 square feet. Say plainly that this is a wider floor than several pages in our own cluster quote for the same player counts - the 2026 setup breakdown tracks a four-player starter at up to 40 square metres and a full eight-player build at 80 to 120 square metres (what a 2026 VR arcade setup really costs), and the space-per-attraction formula puts a four-player arena at 30 to 40 metres and a six-player arena with obstacles at 50 to 60 (how many square meters each arcade machine needs). The sheet and the articles are measuring different things, a bare tracking floor versus a room a guest walks through, so pick one basis per quote and name it. Add queueing, the check-in and headset station, storage for cases and charging, and an accessible route through the space, and the leasable area above a four-player arena is realistically 900 to 1,200 square feet before you seat anybody.
| Configuration |
Specified play area |
Square feet, play area only |
Realistic leasable area with back of house |
| 4 player free-roam, standing platform or arena |
L8 x W8 m (arena 2.0), or L6 x W6 m / L7 x W5 m on the smaller build |
about 690 sq ft, or 377 to 388 sq ft |
900 to 1,200 sq ft |
| 6 player free-roam arena |
L10 x W10 m |
about 1,075 sq ft |
1,400 to 1,800 sq ft |
| 8 to 10 player free-roam arena |
L10 x W15 m |
about 1,615 sq ft |
2,000 to 2,600 sq ft |
| Chair corner, 3 to 6 units |
Cabinet footprints of 1.2 x 1.2 m single and 1.4 x 1.7 m twin, published in the chair density guide, with clearance measured from the motion arc |
depends on layout |
320 to 540 sq ft, converted from the 30 to 50 square metre corner start in the budget guide |
Source basis: play-area dimensions and player counts are the published parameters on the Infinity free-roam arena and standing platform product pages, re-read live and captured as fingerprinted text snapshots in our evidence folder on 2026-09-20 (the arena 2.0 sheet prints L8xW8m for four players, L10xW10 for six and L10xW15 for eight to ten; the second arena sheet prints L6*W6m and L7*W5m as a four-player example; the standing platform sheet prints four players and no area row). Clear-height, clearance and power bands come from the published site-readiness guide on this site. The single and twin cabinet footprints are published in the chair density guide and restated in the fleet scaling guide. The 320 to 540 square foot figure is our own conversion of the 30 to 50 square metre VR corner start published in the equipment budget guide, not a specification. The leasable-area column is our working allowance for queueing, check-in, charging and circulation around a specified play area; it is not a code requirement, and it should be checked against your own layout.
Power is the third filter, and the one landlords and their property managers most often answer incorrectly. Our chair specification asks for a three-phase 380 V supply on a dedicated circuit from 15 kW, with 22 kW and surge protection recommended; the published cost work puts a pre-signing electrical site audit at USD 400 to USD 800 (what ceiling and power 360 VR chairs need). In the US that conversation becomes 208 V or 480 V three phase, or a transformer, or an upgrade to the panel that the landlord will not pay for. Ask the question in the first email about a property, not the fourth, because a panel upgrade is a capital item and a metre of clear height is not something you can buy later.
One more conversion worth nailing down now: the safety volume around a motion chair. The published site-readiness guide gives two numbers and they are not alternatives on one slider. Its minimum is 1.2 m measured outward from the motion arc with no fence; its recommended figure is 1.5 to 2.0 m with a safety fence in place (what ceiling and power 360 VR chairs need). Quoting the pair as one band of 1.2 to 2.0 m hides the one variable that actually matters, which is whether the perimeter is fenced. There is a third number loose in our own cluster, and it is worth naming rather than reusing: two of our published pages carry a 3.5 m figure around a rotating chair, one calling it perimeter safety clearance (how to scale a VR simulator chair fleet from one chair to five ) and one calling it a minimum safety radius, and the first of them attributes it to the site-readiness guide, which never prints it. We have that conflict open on our own list. Until it is settled, treat any radius figure as a layout input to be drawn from the machine centre on your plan, not as a spec to hand a landlord.
3. Layer One - Place: What The Address Itself Costs
This is the layer most US cost guides collapse into one word, and one word is where the accuracy dies. Rent per square foot is not one number for a metro; it is a number for a product class, a submarket, a lease basis and a quarter, and three of those four vary more than the metro name does. The figures below come from one publisher, one report family and one basis per city, so they are at least comparable to each other on their own terms. They are Cushman and Wakefield MarketBeat retail reports, and each row carries the quarter it was published for.
Phoenix first, because it is the freshest number in the set and the most useful. The Q2 2026 Phoenix retail MarketBeat gives metro average asking rent of USD 20.11 per square foot per year on a triple net basis, up 6.3 percent year over year from USD 18.84, with metro retail vacancy at 5.0 percent and flat quarter over quarter. The same report breaks submarkets out on that one basis: Phoenix CBD at USD 42.36, East Phoenix at USD 32.16, and Southwest Phoenix at USD 13.32. That is a factor of 3.2 between the cheapest and the most expensive part of the same metro, on the same day, for the same product class.
Atlanta is the sentence that should be read carefully, because it is where the usual story falls apart. The Atlanta retail MarketBeat for Q4 2025, and that is the current edition of that report; Atlanta retail is not published quarterly in the way Phoenix now is. It gives metro average asking rent of USD 19.19 per square foot per year, also triple net, also on the same basis the publisher states in its own footnote. Atlanta is 92 cents per square foot below Phoenix. On a 1,200 square foot room that is a USD 1,104 a year difference, which is about half of one month of an attendant wage in that metro. Meanwhile Buckhead, inside Atlanta, asks USD 46.11, which the same report describes as a 140.3 percent premium over the metro average.
| Metro and basis |
Asking rent, per SF per year |
Direction |
Vacancy or availability |
Report quarter |
| Phoenix metro, triple net asking |
USD 20.11 |
up 6.3 percent year over year |
5.0 percent |
Q2 2026 |
| Atlanta metro, triple net asking |
USD 19.19 |
down 1.0 percent year over year, up 3.3 percent quarter over quarter |
4.5 percent |
Q4 2025 |
| Manhattan prime corridors, gross asking |
USD 268 on Third Avenue, USD 329 in Flatiron and Union Square West, USD 2,447 on Upper Fifth Avenue |
up 2.0 percent year over year market wide |
10.8 percent availability, described as a record low |
Q1 2026 |
The third row is deliberately not comparable and the reason is the single most common way a buyer misreads a US listing. Phoenix and Atlanta are quoted triple net, meaning the tenant pays taxes, insurance and common area maintenance on top of the number printed. Manhattan is quoted gross, meaning those costs are inside the number. There is no arithmetic in this guide that turns one into the other, because the reimbursement load sitting underneath a triple net rent is not published for any of these three metros by any source we could reach. So the Manhattan row lives in its own unit, and a reader who compares USD 20.11 to USD 268 has compared a rent to a rent-plus-bill.
Manhattan also fails the product test rather than the basis test. That report covers 11 named prime corridors, Fifth Avenue and Madison Avenue and the Times Square Bowtie, not neighbourhood centres and not outer-borough storefronts. The most relevant thing in it for a VR operator is not a rent at all: the same Q1 2026 report says health and wellness concepts rolling four-quarter leasing passed 500,000 square feet, up 69.6 percent year over year, spanning large-format gyms, Pilates studios and pickleball courts, and that food and beverage took 29.7 percent of deal count, while the deal the report singles out as its marquee transaction of the quarter is a 54,000 square foot museum lease in Lower Manhattan. Read that as the landlord side of your negotiation: experiential demand is what a US landlord is currently competing for space over, which is leverage, but only in the corridors where that report says it is happening.
Before the source note, one more rent table, because it is the one that stops a reader using the wrong number. The same publisher, the same quarter and a different product: its Q2 2026 preliminary national retail series puts the US shopping-centre average asking rent at USD 25.65 per square foot per year, up 2.2 percent year over year, and its metro ladder runs from Akron at USD 13.72 and Buffalo at USD 14.91 through secondary and mid-major cities in the high teens and low twenties, Sun Belt growth markets at USD 24.27 in Charleston, USD 24.64 in Atlanta, USD 26.74 in Phoenix and USD 27.58 in Charlotte, and coastal and leisure leaders at USD 30.25 in Orlando, USD 31.24 in Austin, USD 37.60 in Palm Beach, USD 42.27 for the New York City metro and USD 43.92 in Miami. That is 3.2 times from the bottom of the table to the top, and it is the closest thing this evidence set has to a clean answer to the question the title asks, with one caveat the report itself does not settle: the series does not state whether those asking rents are gross or net, so this ladder is comparable within itself and cannot be loaded onto or stripped down to the triple net figures above.
And now the part that keeps a guide like this honest. Phoenix appears twice in reports from the same publisher in the same season, at USD 20.11 in the retail MarketBeat and at USD 26.74 in the shopping-centre series. New York appears at USD 42.27 as a metro shopping-centre composite and at USD 268 to USD 2,447 as prime Manhattan corridors. Neither pair is wrong. The first is all retail including neighbourhood centres, the second is enclosed and open-air shopping centres only, and the third is a flagship product class that no 1,200 square foot arcade will ever be quoted. A buyer who takes the highest number for their market and the lowest for their competitor has not compared two markets, they have compared two products, which is how a 25 percent rent argument becomes a 400 percent rent argument in a spreadsheet.
What a US shopping-centre tenant actually signs is documented better by the landlords than by any listing. Simon Property Group 10-K for fiscal 2025, filed February 25, 2026, reports average base minimum rent for US malls and premium outlets of USD 60.97 per square foot as of December 31, 2025, up 4.7 percent on the year, and it says out loud what that number excludes: company owned space other than anchors, majors, freestanding and outlots. Regency Centers 10-K for the same year states that leases for tenant space under 10,000 square feet generally run initial terms of three to seven years, and that those leases typically provide for fixed base rent plus a pro-rata share paid by the tenant for real estate taxes, insurance and common area maintenance, plus reimbursement for utilities that are not separately metered. Regency also carries the line a thin-margin operator should read twice: those costs generally do not decrease when occupancy or rental rates fall, and the same filing notes material increases in insurance cost in recent years.
Two consequences for a VR venue, and they are structural rather than local. A mall in-line base minimum rent at USD 60.97 is a different universe of money from a USD 20.11 retail street number, and the experiential-tenant demand this guide quoted from the Manhattan report is exactly what mall landlords are leasing space to, which means the mall pitch is real but it is priced like one. And a triple net lease means the rent line in your budget is the floor of a fixed charge, not the total: the reimbursement stack rides on top of it, does not scale down when trade is slow, and is the least visible number in the deal. The only honest instruction in this guide is the one in the checklist below - ask for actuals from last year for taxes, insurance and common area maintenance, per square foot, in writing.
Source basis: Phoenix, Atlanta and Manhattan figures are from the Cushman and Wakefield MarketBeat retail reports for Q2 2026, Q4 2025 and Q1 2026 respectively, PDFs retained on our file dated 2026-09-20, with the rate basis taken from the printed footnote of each report. The metro ladder is from the national series published by the same firm for Q2 2026 preliminary, where each row is printed twice in a two-column table and only the first and last quarter columns can be read with confidence, so the inner cells of those rows are not quoted here. The Simon and Regency figures are from the annual reports those two REITs filed on Form 10-K for fiscal 2025. Two limitations travel with every number in this section. First, these metros rest on a single publisher; we tried CBRE, JLL and Kidder Mathews for a second opinion and none published a reachable 2026 metro figure for Phoenix or Atlanta, so this is one house view of the market, internally consistent but not corroborated, and the shopping-centre ladder is a cross-product check rather than a cross-publisher one. Second, the Atlanta report is one to two quarters older than the other two, which is why the quarter is printed next to every figure rather than in a shared column.
Build-out is the second half of the place layer, and it behaves completely differently from rent. Denver-based design-build firm Terrapin Construction Group published a retail tenant-improvement benchmark set in July 2026, re-based to Q3 2026 costs, and its city bands put mid-tier retail fit-out at USD 88 to USD 145 per gross square foot in Atlanta and USD 150 to USD 245 in New York City. That is a factor of about 1.7 between the cheapest and dearest market in the set, against a rent spread that is 3.2 times inside one metro and grows far larger only when you compare product classes this guide deliberately keeps apart. Construction labour and local permitting do move, but they do not move the way a lease does.
The same source is more useful for the two adjustments than for the headline band. Its benchmarks are hard costs only, in second-generation space in an average shell, and it adds 8 to 15 percent for soft costs and 5 to 10 percent construction contingency on top. It then prices the shell itself as a separate line: cold dark shell adds USD 60 to USD 130 per gross square foot, gray shell USD 45 to USD 100, white box USD 30 to USD 80, vanilla shell USD 20 to USD 60, and second generation USD 25 to USD 200 and up. The page states that shell condition alone swings cost 30 to 50 percent, which is a larger number than most of the differences anyone argues about in a quote.
The place layer in one line: the metro you choose moves rent by dollars, the submarket you choose inside it moves rent by multiples, and the shell you are handed moves build-out by more than either. Ask for the submarket figure, not the metro average, and ask what condition the space is delivered in before you ask what the rent is.
Three things this layer does not have, said plainly so nobody goes looking for them in the wrong place. There is no Phoenix build-out number anywhere in this evidence set; the city table from Terrapin does not cover Arizona, and substituting its Mountain West band would be wrong because that band is Colorado, Utah, Nevada and Idaho. There is no common area maintenance reimbursement figure in dollars for any of the three metros, so the guide can tell you that triple net rent excludes taxes, insurance and CAM and cannot tell you by how much. And there is no arcade or location-based-entertainment fit-out band published by anyone we could reach; the nearest published scopes are the premium retail tier from that firm at USD 150 to USD 300 per gross square foot and its restaurant tier at USD 200 to USD 480, and a VR venue needs more data, power, HVAC, rigging and light control than either. If you use a retail band as a placeholder, say in your own budget that it is a retail band applied by analogy, because it is.
4. Layer Two - People: What The Same Job Costs In Three Metros
The people layer has two halves that get confused constantly, and the confusion costs real money. The first half is the wage, which is what shows up on a job posting. The second is the employer cost, which is what leaves your bank: the wage plus the employer-paid share of health insurance, paid leave, supplemental pay, retirement, and legally required items including payroll taxes and workers compensation. The US Bureau of Labor Statistics measures the first in its Occupational Employment and Wage Statistics programme and the second in its Employer Costs for Employee Compensation programme, and the two are different surveys, different periods and different populations.
The wage half, metro by metro. From the OEWS May 2025 estimates, for occupation code 39-3091, Amusement and Recreation Attendants, the hourly mean wage is USD 17.04 in Phoenix-Mesa-Chandler, USD 13.00 in Atlanta-Sandy Springs-Roswell, and USD 18.23 in the New York-Newark-Jersey City area. Annualised at full time, that is USD 35,440, USD 27,040 and USD 37,910. Atlanta is the cheapest floor labour of the three by a wide margin, 23.7 percent below Phoenix on the same measure, and the same page shows the Atlanta 10th percentile at USD 8.51 an hour, which sits close to the federal wage floor and tells you some employers there are paying near statute.
Then the finding that stops the tidy story. For first-line supervisors of retail sales workers, code 41-1011, the same May 2025 series prints hourly means of USD 25.15 in Phoenix, USD 25.94 in Atlanta and USD 30.57 in New York. Atlanta is above Phoenix. So there is no monotonic cheap metro, and an operator budgeting an Atlanta floor on the assumption that every role is 24 percent cheaper than Phoenix is wrong about the one role that runs the floor. Wage spreads are per occupation, not per city, and the role that manages your floor is not priced by the same market that supplies your attendants.
| Measure, at wage only |
Phoenix |
Atlanta |
New York |
| 39-3091 attendant, hourly mean |
USD 17.04 |
USD 13.00 |
USD 18.23 |
| 39-3091 attendant, hourly median |
USD 16.18 |
USD 12.96 |
USD 17.26 |
| 39-3091 attendant, annual mean |
USD 35,440 |
USD 27,040 |
USD 37,910 |
| 41-1011 retail supervisor, hourly mean |
USD 25.15 |
USD 25.94 |
USD 30.57 |
Source basis: US Bureau of Labor Statistics Occupational Employment and Wage Statistics, May 2025, metropolitan area estimates, cross-industry. All four rows are wage only and exclude any employer-paid benefit. These are cross-industry estimates for the whole metro labour market, not what entertainment venues specifically pay: BLS does not publish an industry by metro by occupation table, so a NAICS 713 arts, entertainment and recreation cut of these same jobs does not exist as a public figure. The metro estimates are diluted by stadium, museum, water park and fair employers, which is the honest limit of the proxy.
Now the burden half, and the reason not to reach for the famous number. The June 2026 ECEC release, USDL-26-1494, puts total employer compensation for private industry workers at USD 46.89 an hour, made of USD 32.82 in wages and USD 14.07 in benefits, which is the 70 percent and 30 percent split everybody quotes. It is the wrong split for an arcade. The same release puts part-time private industry workers at USD 25.20 total, USD 20.15 in wages and USD 5.05 in benefits, which is 80 percent and 20 percent, because part-time staff in the US overwhelmingly do not carry the employer-paid health and retirement load that full-time staff do. Arcade floor staffing is part-time staffing. Multiplying an attendant wage by 1.43 on the all-workers split overstates your cost; the defensible multiplier for a part-time attendant on these published splits is 1.25.
There is a published sanity check on that. The same June 2026 release gives total employer compensation for full-time workers in leisure and hospitality at USD 27.95 an hour worked and for part-time workers in that industry at USD 17.21, and amusement, gambling and recreation industries sit inside leisure and hospitality. A burdened Atlanta attendant lands near USD 16 to USD 17 an hour on the part-time split, which lands about six percent under that published industry figure, while the same person on the all-workers 1.43 multiplier lands near USD 18.60 and overshoots it by eight percent. Neither lands on the published figure, but the lower multiplier is the closer of the two to the one industry number BLS prints, and it is the arithmetically right one for a part-time attendant.
For the burden itself the finest geography BLS publishes is census division, not metro, so the metro-specific part of any employer-cost figure is the wage and the burden share is regional. ECEC Table 7 has private industry wages as 72.3 percent of total compensation in the Mountain division, which contains Arizona, 71.5 percent in South Atlantic, which contains Georgia, and 68.3 percent in Middle Atlantic, which contains New York. Those three rows are all-workers shares, so dividing a metro wage mean by its division share gives the expensive reading of the job: an implied multiplier between 1.38 and 1.46 rather than the 1.25 a part-time attendant supports. Both are carried in the table below because they answer two different questions. The 1.25 line is what two floor attendants cost a venue that schedules part time, which is the arcade case; the division line applies the all-workers share, which is the closer reading for a venue whose attendants are staffed to carry the full benefit load. Every number in that pair is our arithmetic on two BLS products, not a BLS number, and it should be cited that way or not at all.
| Per attendant, annual |
Phoenix |
Atlanta |
New York |
| Wage only, OEWS May 2025 mean |
USD 35,440 |
USD 27,040 |
USD 37,910 |
| Burdened at the part-time 80/20 split (our arithmetic) |
USD 44,300 |
USD 33,800 |
USD 47,388 |
| Employer-paid benefit dollars inside that figure |
USD 8,860 |
USD 6,760 |
USD 9,478 |
| Two attendants, burdened at the part-time split |
USD 88,600 |
USD 67,600 |
USD 94,776 |
| Two attendants, upper bound at the division share |
USD 98,036 |
USD 75,636 |
USD 111,010 |
Read the two-attendant rows, because that is the line a venue actually carries. A room staffed by two attendants at all times sits at the top of the one-to-two band our published staffing formula gives a free-roam arena (how many staff you need per arcade shift), and on the part-time split that headcount costs about USD 21,000 more a year in Phoenix than in Atlanta and about USD 27,200 more in New York than in Atlanta, none of which shows up in a rent comparison. On our 1,200 square foot worked example, Phoenix metro rent is USD 24,132 a year and the second attendant alone is USD 44,300, or USD 49,018 on the all-workers division-share upper bound. In this layer the wage is not the tail. It is most of the dog.
Source basis: wages are BLS OEWS May 2025. Benefit shares and the part-time and leisure-and-hospitality totals are BLS ECEC, release USDL-26-1494, reference period June 2026, pages retained 2026-09-20. Four limits travel with the two burdened rows. They multiply a May 2025 wage by a June 2026 share, so they carry no wage escalation into the present. The part-time 80/20 split is a national private-industry figure, not an Arizona, Georgia or New York one, so it is applied identically in all three columns and any local difference in benefit take-up is invisible here. The OEWS rows cover private, federal, state and local employers cross-industry while ECEC Table 7 is private industry only, so the two populations are not identical. And the division shares are nine-state or three-state averages with no metro information in them at all. One more shelf-life warning that belongs in a guide dated 2026: BLS has announced that ECEC removes workers compensation costs beginning with the December 2026 reference period, so the 70 percent and 30 percent split quoted here, and every benefit share derived from this vintage, will not be reproducible from the next-but-one release.
5. Layer Three - Paper: What The State And The County Add
The paper layer is the one an imported equipment budget never sees, because no factory quotes it and no freight forwarder invoices it. It is also the layer where the numbers are smallest and the surprises are largest: a machine tax is a few dozen dollars, and the paperwork around it has deadlines, per-location multipliers and penalties that are a multiple of the tax.
Texas is the cleanest illustration because it states its rate as a flat amount. The Comptroller collects a coin-operated machine occupation tax of USD 60 a year on each machine displayed in the state, evidenced by a permit decal that must be visible and securely attached to every machine, and it can be prorated quarterly for machines placed in service during the year. Alongside it sits a licence, and which licence you need is a real branch, not a formality: a general business licence costs USD 200 annually for 50 or fewer machines, USD 400 for 51 to 200 and USD 500 for 201 or more, an import licence is USD 500, and a registration certificate, available only to a business that exhibits machines solely in its own place of business with no machines in any third-party venue and no other financial interest in the industry, is USD 150. All renewals are due annually on November 30, and the same fee table rises by postmark date to USD 400, USD 800 and USD 1,000 for filings dated April 1 or after.
Two of the three metros this guide reads line by line price the paper layer through an entirely different door, and for New York the door is bigger than the Texas one. The New York State Department of Taxation and Finance bulletin on admission charges states that admission charges to, or for the use of, any place of amusement located in New York State are subject to state and local sales taxes at the 4 percent state rate plus applicable local tax, defines a place of amusement as any facility where entertainment, amusement or sports are provided, and bundles into the admission charge any service charge, cover charge and any other charge for entertainment, amusement or use of the facilities. Charges of 10 cents or less are not subject to tax. That definition reaches a VR arena by what the room does rather than by how the guest pays, which makes it the surer hook of the two families, and it applies to your receipts rather than to your equipment. Georgia runs the machine side through a licence chain instead of a tax return: the November 2024 State Auditor report on the coin-operated amusement machine programme says the programme is overseen by the Georgia Lottery, that net revenue is shared with master and location licensees, that master licensees take a 43.5 percent share of net revenue, or 43.5 cents per dollar, and that COAM receipts currently sit under a sales tax exemption the audit was studying removing. If a VR cabinet in Georgia falls inside that programme, what you are negotiating is a revenue share rather than a rate, which should be settled before a lease rather than after one.
A six-machine arena in Texas therefore lands somewhere between USD 510 and USD 560 for its first licence year, machine tax and whichever of the general business licence or the registration certificate applies, and that is the whole point: the amount is trivial and the mechanism is not. The decal is the thing an inspector looks at. A missing decal or a machine count that is wrong is a per-machine problem, not a one-time fine, and Texas taxes the same machines again as property.
Florida does the same job through two different doors and they should not be merged. Its tangible personal property rules mean anyone owning business property on January 1 files a TPP return with the county property appraiser by April 1, with an exemption of up to USD 25,000 of assessed value available if the return is filed on time, and a filing waiver that continues in later years while value stays at or below USD 25,000. Failure to file carries a penalty of 25 percent of the tax levied for each year the return is missing. Then, separately, the Department of Revenue administers an amusement machine regime under which the operator buys an annual Amusement Machine Certificate at USD 30 per machine at each location, displays it at every location, renews before the certificates expire on June 30, registers as a sales and use tax dealer in each county where a machine operates, and faces a USD 250 per machine penalty for a missing certificate or for a certificate that lists fewer machines than are actually on site. Six machines in one Florida location is USD 180 a year, and six machines at each of three locations is USD 540, which is the per-location multiplier that catches people who budgeted by company rather than by room.
Texas taxes the same machines a third way, as property, and here the threshold is the story. Business personal property is appraised as of January 1 at market value and the owner files a rendition with the appraisal district, due April 15 in the general case, with a penalty of 10 percent of the taxes for failing to file a rendition on time and 50 percent for a false one. If the total taxable value of your personal property is USD 125,000 or less in any one taxing unit, the property is exempt in that taxing unit. A USD 28,000 four-player arena and a USD 85,000 eight-player arena both sit under that threshold in a single taxing unit, which is a genuinely useful fact and is exactly the sort of fact that stops being useful the moment your venue has three rooms in three counties, because the test is per taxing unit and the total is what you own in each one.
| Jurisdiction |
What is charged |
Amount on disk |
The mechanics that bite |
Source period |
| Texas |
Coin-operated machine occupation tax, state |
USD 60 per machine per year |
A visible decal per machine, renewal November 30 |
Comptroller page read 2026-09-20 |
| Texas |
Licence or registration certificate |
USD 150 to USD 500 a year |
Which one applies is conditional; late postmarks cost up to USD 1,000 |
same |
| Texas |
Machines as business property |
No rate published; exemption at USD 125,000 or less per taxing unit |
Rendition by April 15, 10 percent penalty for late filing, 50 percent for a false one |
same |
| Florida |
Amusement machine certificate |
USD 30 per machine at each location |
Expires June 30, USD 250 per machine penalty, register per county |
DOR publication revised 09-2018, read 2026-09-20 |
| Florida |
Machines as tangible personal property |
No rate published; USD 25,000 exemption if filed by April 1 |
File with the county appraiser, 25 percent of tax for a missing return |
DOR page read 2026-09-20 |
| New York |
Sales tax on the admission instead of on the machine |
4 percent state plus applicable local |
Service charges, cover charges and other use charges fold into the admission charge |
Tax bulletin read 2026-09-20 |
| Georgia |
COAM programme run by the Georgia Lottery |
Master licensees take 43.5 percent of net revenue; receipts currently sales-tax exempt |
A licence chain and a revenue share, not a self-assessed return |
State Auditor report, November 2024 |
Source basis: Texas Comptroller coin-operated machine tax pages and publication 96-256, and the Texas property tax valuation pages; Florida Department of Revenue tangible personal property page and publication GT-800020, revision 09-2018. Snapshots retained 2026-09-20. What is deliberately absent: no Texas or Florida property tax rate, millage or assessed-to-tax conversion appears in any source we could verify, because in both states local taxing units set the rate, so this guide gives thresholds and deadlines and not a dollar of tax. Two other gaps worth naming. South Dakota appears in our snapshot set only as a state that assesses property at full and true value and then equalizes to 85 percent for property tax, plus a secondary source that says it levies no general tangible personal property tax; the revenue department amusement machine page that would settle it was not captured, so South Dakota is unproven here and we are not filling the hole with inference.
Now the classification question that sits underneath all of it, and it is worth stating as an open question because most guides answer it as settled. Across every state revenue page in this evidence set, zero states name virtual reality, a headset or an arcade as a tax category. The closest language is the enumerated list in Florida, which includes arcade games or video games and mechanical rides under coin-operated amusement machine, and the Texas definition, which covers all types of electronic devices that require the customer to insert a coin, bill, metal slug, token, electronic card or check to play a game, music or pleasure machine.
The Texas definition includes an electronic card, which is a card tap at a kiosk and most modern POS. The Florida definition says coin, slug, token, coupon or other similar device, and does not define other similar device. And the counter-example is on the record: in document 20-166, issued September 15, 2020, Virginia Tax concluded that on the information before it the device paid for by credit or debit card appeared not to be deemed a coin-operated amusement machine for that state and local licence tax, because the statute says coin-operated and has not been read to include card payment, and the same letter refers the local licence question to the local Commissioners of Revenue. Same payment mechanism, three states, three answers, and one of them is a written ruling on the wording of one statute.
The honest instruction is procedural rather than substantive. Ask the county appraiser and the state revenue department, in writing, which schedule a free-roam VR arena and a rotating headset chair fall under, and get the answer before you sign, because the answer determines whether you owe a decal per machine, a per-location certificate, a property rendition, or all three. The long-tail search intent behind a question like whether you need a licence to run coin-operated VR machines is real, and the truthful answer is that in Texas and Florida, yes, and the licence is cheap and the paperwork is not.
Music licensing and general accessibility design are covered on this site in their own places rather than re-taught here - see the published walk-through of what licences an arcade venue needs (what music licensing an arcade venue needs) and the accessible venue design guide (how to design an accessible arcade for all guests). What belongs in a cost article is the one accessibility rule with a ratio in it, because it is a build-out line and nobody budgets it.
Under 28 CFR 36.403, an alteration to an area containing a primary function triggers a path-of-travel obligation, and the regulation defines when the required accessibility work is deemed disproportionate: when the cost of providing an accessible path of travel exceeds 20 percent of the cost of the alteration to the primary function area. The denominator is that alteration, not your whole project, and the same section counts toward it the cost of an accessible entrance and route to the altered area, accessible restrooms, accessible telephones and relocating an inaccessible drinking fountain, with restrooms, telephones and drinking fountains serving the altered area included in the path of travel itself.
Two further sentences in that section are the ones a phased arcade fit-out trips. A tenant making alterations in areas it alone occupies does not trigger a path-of-travel obligation on the landlord for areas under the authority of the landlord, which means the obligation on your side of the lease line is yours. And the obligation cannot be evaded by a series of small alterations to an area served by a single path of travel if they could have been done as one undertaking; where later alterations to the same path of travel happen within three years of an earlier one, the total cost over that three-year period is counted together. If you plan a phase one arena floor and a phase two restrooms, that three-year rule is a budgeting rule, and it is the single most expensive piece of paper in this layer that nobody in the room has read.
Source basis: 28 CFR 36.403 as published in the electronic Code of Federal Regulations, Subpart D, retained 2026-09-20, read from the same capture twice. Two things that section does not do: it does not print a dollar figure, and no dollar ADA minimum appears anywhere in this evidence set, so the 20 percent is a ratio with a named denominator and nothing more. It also does not say that an arena floor is an area containing a primary function; the regulation examples are a bank customer services lobby, a cafeteria dining area, conference centre meeting rooms and offices, and extending that to a play area is an argument to be made to the authority having jurisdiction, not a citation to be waved. This is the first page on this site to state the path-of-travel rule, so it carries its own citation rather than an internal link.
6. What A Room Has To Earn Back
A cost guide that never mentions earnings is a list of bills, so here is the counterweight, stated honestly about what it is. The throughput and revenue figures below are our own planning models for our own machines. They are not US market statistics, they do not include local pricing power, and every one of them should be tested against what a venue in your actual metro can charge. What they are good for is giving you a denominator, because rent only means something relative to what an hour of play earns.
Start with capacity, because it is the one input that is published rather than invented. Our arena versus cabins throughput comparison runs the arithmetic on a free-roam arena at an 8-minute round plus a 2-minute reset, which is 6 completed rounds an hour, four players on each round, so 24 players an hour through one walking arena; the same page prices both formats at around USD 14.00 a head, which is the number it uses for the comparison (the arena versus five shooting cabins throughput comparison). Multiply the two numbers on that page and a fully booked four-player arena has a gross ceiling of about USD 336 an hour. Read that as a ceiling and nothing else: it assumes nobody leaves the queue empty, and our own mall P and L works at a blended occupancy of 55 to 65 percent instead (the mall VR arena P and L broken down by revenue stream). What the ceiling is good for is the only comparison that makes rent meaningful, which is what one hour of a fully used room earns against what one hour of that address costs.
Three more published models are worth reading side by side, because they disagree and the disagreement is the useful part. The launch model puts a healthy 200 square metre arena at about USD 320 per square metre per month at good utilisation (how to launch a profitable VR arena with an ROI and payback model). The mall model reaches about USD 20,000 a month across six revenue streams, and it is explicit that the number belongs to a 70 to 90 square metre free-roam combat arena in a working mall location run on six streams rather than one ticket booth (the mall VR arena P and L broken down by revenue stream). The conservative view is the year-one model, which prints per-station monthly gross of about USD 1,800 to USD 4,800 by named utilisation scenario rather than a headline day rate (the per-station monthly revenue model for year one). There is a fourth published walk-through that works a 60 square metre arena down to a day rate (the 60 square metre arena session scheduling walk-through); we link it and do not restate its total here, because its own printed chain does not reproduce the number in its own heading, and a cost guide should not inherit a rounding error that belongs to another page, even when that page is ours. Read together the four pages bracket a range, they do not name a number.
| Denominator |
Figure |
What it is |
What it is not |
| One four-player arena, one hour |
24 players, about USD 336 gross at the USD 14.00 a head used on the same page |
Arithmetic on the round length, reset, player count and ticket price that one published comparison prints together |
A street price survey, and it assumes every round is full |
| Revenue per square metre |
about USD 320 per square metre per month at good utilisation |
Our published planning figure for a healthy 200 sq m arena |
A median, and it is a ceiling not a floor |
| Chair payback |
a USD 32,000 equipment package recovered in 5 to 6.5 months when the venue opens on schedule |
The model line from the site-readiness guide |
The only payback we publish: the same cluster carries 4.5 to 5.5 months on a five-chair zone, 4.5 to 6.5 in the FAQ of that guide, and 6 to 9 months for a four-cockpit racing zone |
| Year-one station revenue |
about USD 1,800 to USD 4,800 per station per month by utilisation scenario |
The published year-one model, which is the conservative view |
Independent of your trade area, which it cannot be |
The only test that matters in a cost article: divide the monthly fixed cost of the address by the hours you can realistically sell, and see what each hour has to earn. Location decides the numerator. Your pricing and your trade area decide the denominator. Most failed budgets argue about the numerator and never test the denominator.
Maintenance and consumables sit between the two, and they are the least state-dependent part of the operating line. The published simulator cost work prices them in three separate families, and collapsing them into one yearly number is how budgets go wrong: replacement headsets for a commercial duty cycle of around 2,500 hours run USD 600 to USD 2,500 a unit, joystick and headstrap wear parts run USD 50 to USD 200, and seat motors and sensors run USD 300 to USD 1,000 on a replacement cycle rather than per year (what a VR fighter jet simulator costs to buy and to keep). The same page budgets a ten-machine floor at USD 6,000 to USD 18,000 a year and a spares pool at about 10 percent of capital cost, while the maintenance guide carries the routine itself and the three surfaces that fail (VR chair maintenance and what breaks) and the racing cockpit version of the same discipline is walked through separately (how to maintain a commercial VR racing simulator). None of those lines moves if you open in Dallas instead of Denver. The labour rate you pay the person doing the work does, and that is the next section.
7. One Room, Three Metros: The Same Floor Plan Priced Six Ways
This is the section the article exists to write, and it is the only one where we do arithmetic in public. The room is fixed: 1,200 square feet with a four-player free-roam arena in it, which is the leasable area the second section of this guide lands on once queueing, check-in, charging and an accessible route are added to a specified 8 by 8 m play area. The equipment is fixed, and the price walk behind it is published separately (how much a free-roam VR arena costs ). The staffing is fixed at two attendants on the floor. What changes is the address, and the only inputs used are the rent and wage figures already sourced above, so any line here can be traced back two sections.
The comparison is stated as cost per staffed operating hour, because that is the unit a US lease and a US payroll both convert into. The working assumption is 12 hours a day, 30 days a month, so 360 open hours, which is our assumption and not a source. Rent and two burdened attendants are the whole numerator. That deliberately excludes equipment finance, utilities, insurance, marketing, taxes on receipts and the second shift, so what follows is a floor, not an operating budget.
| Address, and the rent input used |
Rent a month |
Two burdened attendants a month |
Both, per open hour |
Per head at 24 an hour |
Per head at 60 percent occupancy |
| Southwest Phoenix, USD 13.32 per SF NNN |
USD 1,332 |
USD 7,383 |
USD 24.21 |
USD 1.01 |
USD 1.68 |
| Phoenix metro average, USD 20.11 per SF NNN |
USD 2,011 |
USD 7,383 |
USD 26.09 |
USD 1.09 |
USD 1.81 |
| Phoenix CBD, USD 42.36 per SF NNN |
USD 4,236 |
USD 7,383 |
USD 32.28 |
USD 1.34 |
USD 2.24 |
| Atlanta metro average, USD 19.19 per SF NNN |
USD 1,919 |
USD 5,633 |
USD 20.98 |
USD 0.87 |
USD 1.46 |
| Buckhead, USD 46.11 per SF NNN |
USD 4,611 |
USD 5,633 |
USD 28.46 |
USD 1.19 |
USD 1.98 |
| Third Avenue Manhattan, USD 268 per SF gross |
USD 26,800 |
USD 7,898 |
USD 96.38 |
USD 4.02 |
USD 6.69 |
Rent plus two burdened attendants, per staffed open hour, one 1,200 sq ft room (our model on published inputs)
Atlanta metro average, triple net
USD 20.98
Southwest Phoenix, triple net
USD 24.21
Phoenix metro average, triple net
USD 26.09
Buckhead Atlanta, triple net
USD 28.46
Phoenix CBD, triple net
USD 32.28
Third Avenue Manhattan, gross
USD 96.38
Six addresses, one floor plan, 360 open hours a month. Bar width is scaled to the dearest address. The five triple net bars exclude taxes, insurance and common area maintenance; the Manhattan bar includes them inside a gross asking rent, so the true gap is narrower than the picture implies.
Basis and boundaries: rent per square foot and per year come from the Cushman and Wakefield MarketBeat rows quoted in the Place layer, at the quarter printed there, multiplied by 1,200 square feet and divided by 12. Attendant costs are the burdened annual mean derived in the People layer from BLS OEWS May 2025 wages grossed up on the ECEC June 2026 part-time wage share of 80 percent, divided by 12 and doubled, which is our arithmetic and not a BLS publication. On the all-workers division-share upper bound instead, the two-attendant monthly figures become USD 8,170 in Phoenix, USD 6,303 in Atlanta and USD 9,251 in New York, which moves every rent-to-payroll ratio in the table by 11 to 17 percent and changes none of its conclusions. Per head columns divide the per open hour figure by the 24 players an hour capacity ceiling published in the arena versus cabins comparison, then by 60 percent of it, which is the midpoint of the 55 to 65 percent blended occupancy used in our own mall model. Two cautions. The Manhattan column is gross asking rent, so taxes, insurance and common area maintenance are already inside its number while the five other columns exclude them; the true gap is smaller than the ratio implies and cannot be closed with the evidence in this guide. Arizona machine and build-out figures are absent because no Arizona source in this evidence set publishes them, not because they are zero.
What the table says is not the thing the genre usually says. At five of the six addresses the two attendants cost more per month than the rent does - in Southwest Phoenix payroll is 5.5 times rent, in metro Phoenix 3.7 times, in metro Atlanta 2.9 times, in Phoenix CBD 1.7 times, in Buckhead 1.2 times - and only on Third Avenue does rent dominate, at 3.4 times payroll. That is the shape of the decision. In a Sun Belt metro the address is mostly a wage question with a rent tail; in a Manhattan prime corridor it is a rent question with a wage tail. A buyer who shops only for rent in Phoenix is optimising the smaller of their two numbers.
The per-head columns are the useful output, and they are gentler than the rent spread suggests, because the two lines we have priced are small next to what a round can earn. The same USD 14.00 ticket that the throughput comparison uses covers rent and two attendants at every address on the list, and it still does at 60 percent occupancy. So the location load in this room does not kill a venue on its own. What it does is decide how much of the rest of the cost stack - the finance line, the utilities, the marketing, the insurance, the second shift, the owner salary - the address leaves standing. That is the honest version of a cost-by-market claim, and it is the version that survives a landlord.
| One-time line, on the same 1,200 SF room |
Atlanta |
New York City |
Phoenix |
| Mid-tier retail fit-out, hard cost only, per gross SF |
USD 88 to 145 |
USD 150 to 245 |
not published in this set |
| Same room at those bands, before soft costs and contingency |
USD 105,600 to USD 174,000 |
USD 180,000 to USD 294,000 |
not published in this set |
| Terrapin adders, same source, per gross SF |
soft costs 8 to 15 percent, contingency 5 to 10 percent, both markets |
same |
same |
| Shell condition on top, if not second generation |
cold dark USD 60 to 130, gray USD 45 to 100, white box USD 30 to 80, vanilla USD 20 to 60 |
same bands |
same bands |
The build-out table is the same arithmetic applied in both cities, and it lands about 1.7 times apart rather than the multiples rent moves in by submarket and product class, and that asymmetry is the last thing this section establishes: rent is where a US market can change your business model, construction cost is where it can change your schedule, and the two are not the same risk. A retail fit-out band applied to a VR venue is an analogy and should be written into your budget as one.
8. Before You Sign A US Lease: The Order To Work In
The reason market-by-market cost deserves its own article is that the US sequence has decision points where the cheapest option closes and nobody tells you it has. This is the order we would work in, with the physical and lead-time facts from our own delivery experience and the commercial steps marked as questions to ask rather than as rules.
The published go-live timeline is 30 days from a placed order to a first paying rider, with 2 to 3 days of on-site installation, about 4.5 hours of calibration and a day of operator training, and the named bottlenecks being an unready site, a delayed container slot and staff who have not rehearsed (how fast a VR arena can go live). Work backwards from that. In a US retail deal, letter of intent to possession commonly runs far longer than a machine lead time, which means the equipment order is not the long pole in your opening. The lease is. Ordering early to beat a construction delay simply parks a depreciating asset in a warehouse, and the finance-versus-buy work on the equipment itself is covered separately (how FECs finance new arcade and VR equipment).
| Step |
What you are locking |
The question that has to be answered in writing first |
| Market choice |
The wage band, the tax treatment of your machines, and the realistic ticket price |
Can this trade area pay the price this model needs at this rent |
| Property shortlist |
Clear height, floor plate, three phase availability, delivery route |
What is the clear height under the ducts, not under the beams |
| Letter of intent |
Rent basis, escalation, term, and who pays for what |
Is this asking rent gross, triple net or modified gross, and what are last year actuals for taxes and common area maintenance |
| Tenant improvement negotiation |
Allowance, design responsibility, landlord work and its schedule |
What does the landlord deliver, to what standard, by what date |
| Accessibility and code review |
Route, entrances, restrooms, reachable seating, and any alteration to a primary function area |
What does the 20 percent path-of-travel ratio add to this job, measured against the cost of the alteration to the primary function area and not to the whole build |
| Insurance and licences |
Limits the landlord requires, plus state and local registrations |
Which of these are annual per machine or per location rather than annual per business |
| Equipment order |
Build, content, crate, freight term, install date |
Which Incoterm, which named place, and what is on the quote that is not on this list |
Three of those rows are where an imported equipment budget typically breaks, and all three now have a section above them. The market choice row is answered by the People layer, because wage and burden, not rent, is what moves between those metros. The tenant improvement row is answered by the Place layer, because an allowance is a negotiated number and the shell condition you are handed is what turns a single per square foot quote into a range 30 to 50 percent wide. The accessibility row is answered by the Paper layer, because the obligation is a ratio with a specific denominator and a three-year look-back, not a fee schedule. If the room you are pricing is bigger than a VR arena, the published centre-level budget work is the right next read rather than a re-scaled version of this one - the family entertainment centre budget guide (what it costs to open a family entertainment center), the indoor entertainment centre build guide (what it costs to build an indoor entertainment center) and the sportainment centre cost walk (what it costs to open a sportainment center) each carry their own line items.
Source basis: the 30-day order-to-open timeline, the installation, calibration and training durations and the named bottlenecks come from the published go-live guide on this site. The lease-sequence rows are a working checklist drawn from how our own deliveries actually get scheduled; they are not legal or brokerage advice, and the commercial terms in the right hand column are questions to ask, not standards to assume.
9. What This Guide Cannot Tell You
A market-by-market cost article earns trust by naming its holes as plainly as its numbers, so here are the ones a reader will hit if they try to turn the three layers above into a signed budget. Each of these was searched for in the primary sources behind this page and is not present in them. Treat the list as the short list of questions to take to a broker, a payroll service, a tax adviser and an insurer, in that order.
- Rent is single-publisher. Every asking-rent row in the Place layer comes from one research series from one firm, in three different quarters. That makes the comparison internally consistent and externally unverified; a second publisher commonly lands a different metro rate on the same product, and where the two disagree this guide cannot adjudicate.
- There is no common area maintenance dollar figure here. The sources establish that tenants reimburse taxes, insurance and maintenance on a pro-rata basis, and that those costs do not fall when occupancy falls, but no primary source in this evidence set publishes a per square foot reimbursement for shop space in any of the three metros. The number that would close your lease model is the one this guide cannot give you.
- There is no build-out band for an arcade specifically. The construction ranges quoted are retail and restaurant fit-out bands on a second-generation shell, hard costs only, and they are used here as an analogy with the analogy stated. Nothing in them prices tracking, rigging, cable containment or a game network.
- There is no Phoenix build-out number. The construction source publishes city tables that include Atlanta and New York and does not cover Arizona, so the Arizona column in the same-room ladder is left empty rather than interpolated from the metro that is geographically nearest.
- Wages are cross-industry, not arcade wages. The hourly means quoted are an occupational code measured across every industry that employs the role in a metro area, so an amusement and recreation attendant in a theme park, a municipal pool and a VR room all sit in the same number. There is no industry-by-metro cut of that survey available at all, which means the true arcade figure in a given metro is unknowable from public data.
- Burden is national or regional, never metro. The wage-versus-benefit split used to turn an hourly mean into a loaded cost is published at the state division level and has no metro row, so New York burden is applied at the regional share, not at the actual rate a Manhattan employer pays.
- The two labour sources are different periods. Wages are from a May 2025 survey and the benefit share is from a June 2026 release, which means the loaded figures mix a 13-month gap and are arithmetic, not measurement. The benefit share itself has a written expiry: from the December 2026 data the underlying source removes workers compensation from the category, so the split quoted here will need re-checking before the next planning cycle.
- There is no street ticket price for any of the three metros. This guide deliberately does not state what a consumer in Phoenix, Atlanta or Manhattan pays to play, because no source in the evidence set establishes one. The revenue denominators used come from published models on this site and are labelled as models every time they appear.
- There is no insurance premium band. The cost blocks list a landlord-required limit as a real line and an insurer as the party that sets it, and that is as far as this page goes. Nothing here estimates a general liability premium by market, state or square footage.
- There is no permitting or utility-upgrade cost. Nothing here prices a US electrical panel, a service upgrade, a mechanical permit or the time a municipal plan-review queue takes. Those sit between the shell you are handed and the day the machine is energised, and they are the most local numbers in the whole stack.
The last category of gap is inside our own published work, and a reader building a budget from this site deserves to see it. The cluster does not fully agree with itself, and the disagreements are recorded rather than averaged away. Floor area for the same free-roam product is carried as 8 by 8, 10 by 10 and 10 by 15 metres on the product sheet as read on 2026-09-20, while published planning pages describe narrower tracking-floor bands at 40, 60 to 80 and 80 to 120 square metres (what a 2026 VR arcade setup really costs ), and the chair-density page carries cabinet footprints rather than arena floors. Payback on comparable equipment is stated as 4.5 to 5.5 months in one place, 4.5 to 6.5 in another and 6 to 9 for a different product format. Round length is a 3 to 5 minute band in one article and a fixed 8 minutes plus a 2 minute reset in another. A working budget should pick one band, name which one it picked, and treat the spread as the risk it is.
What this page can honestly deliver is a method with three named inputs and a set of sourced anchors: rent by submarket on one basis, wage by occupation on one code, and paper by state with the machine counts spelled out. What it cannot deliver is a total. The total is the number your broker, your payroll service and your insurer each own a piece of, and any article that prints one without those three signatures is guessing.
10. Opening a VR Arcade in the USA FAQ
How much does it cost to open a VR arcade in the USA?
The equipment line is the part with a stable answer: a venue-grade simulator chair sits in a published USD 6,000 to USD 12,000 band and a free-roam build runs from roughly USD 28,000 for a four-player setup to about USD 85,000 for an eight-player system, and neither figure moves by state. Everything after the invoice is set by the address, and this guide splits that into three layers - the place, the people and the paper - rather than printing one total that would be wrong for whichever market you are not in.
What is the most variable part of the opening budget?
For most US venues it is payroll, not rent, which is the opposite of what the question usually assumes. In the same-room worked example above, loaded annual payroll for two attendants exceeds the annual rent at five of the six addresses priced, by as much as 5.5 times at the cheapest one, and rent only dominates at the prime Manhattan corridor address. Equipment is the least variable line in the whole stack.
What rent should I expect per square foot?
Expect the basis question before the number. On one triple-net series from one publisher, the Phoenix and Atlanta metro averages land 92 cents per square foot apart on the same footing, while inside Phoenix alone the spread runs 3.2 times from the lowest submarket to the central one, and prime Manhattan corridors are quoted gross, so their taxes, insurance and common area maintenance are already inside the number rather than on top of it. On the same-room example in this guide that Manhattan figure still comes out about 3.7 times the Phoenix metro average, and that multiple is a gross rent against a triple net one, so it overstates the real gap by whatever those three items would have cost in Arizona. Ask whether a quoted rent is gross or triple net, and which quarter it was printed for, before comparing two cities.
Do I need a licence for each VR machine?
In the states covered here, sometimes yes, and the unit matters more than the fee. Texas charges an annual occupation tax per machine with a decal that has to be visible on the unit, plus a general business licence that steps up by machine count, or a cheaper registration certificate if the venue qualifies for one. Florida registers amusement machines on a per machine, per location annual certificate, with a penalty charged per machine for a count that is wrong. Both are small absolute numbers and both are audits that come back to how many units you actually have.
What wage should I budget for floor staff?
Use the occupational mean for your metro, then load it. Amusement and recreation attendants sit at USD 17.04 an hour in Phoenix, USD 13.00 in Atlanta and USD 18.23 in New York on the May 2025 survey, at a wage-only basis. Converting to a real cost means multiplying by the ratio implied by the national benefit share, which for part-time private-industry workers is 20 percent of total compensation, so the honest load is roughly a quarter on top of the wage rather than 43 percent.
Does accessibility work add real cost to a fit-out?
It can, and the trigger is a ratio rather than a fee schedule. Under 28 CFR 36.403, when an alteration affects an area containing a primary function, the cost of making the path of travel accessible is measured against the cost of that alteration, and above 20 percent it is treated as disproportionate, at which point the obligation runs only to the point where it stops being disproportionate. There is no dollar threshold in the rule, the denominator is not your whole build, and a series of small jobs on the same route within three years is assessed as one undertaking.
11. Featured NextPlay Active Gaming Equipment
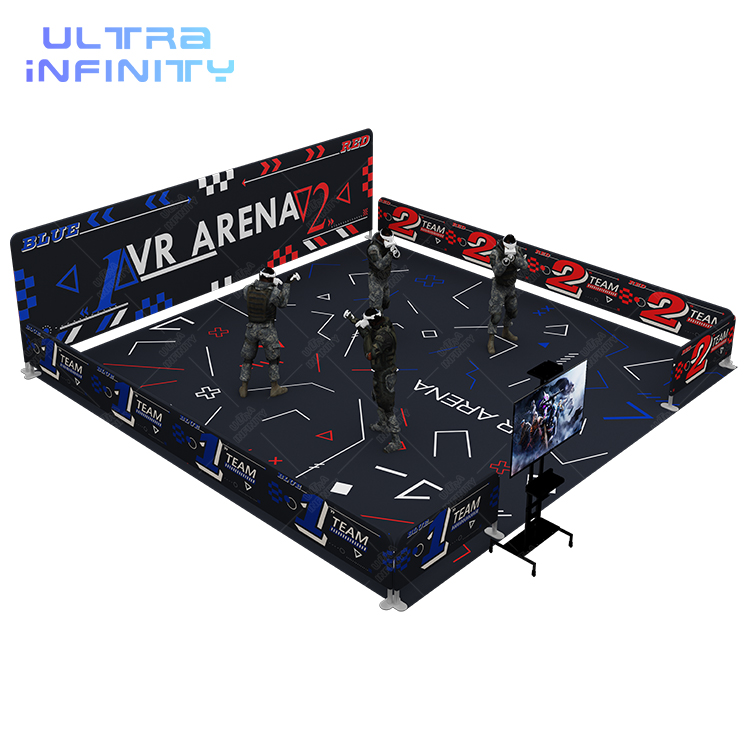
The walking arena: 8 by 8 m at four players up to 10 by 15 m at eight to ten
Free Roaming VR Arena 2.0 - Multiplayer VR Walking Shooting Simulator
This is the build behind the floor areas used throughout the place layer, and it is why the room number matters more than the machine number. The specification sheet as re-read on 2026-09-20 carries 8 by 8 m for a four-player game, 10 by 10 m for six players and 10 by 15 m for eight to ten, which is 64 square metres of bare tracking floor at the small end and 150 at the largest build, and that is the part of your footprint no landlord will shrink. Queueing, check-in, headset storage, charging and an accessible route sit on top of that area, and it is the total that gets priced per square foot.
View Details ›
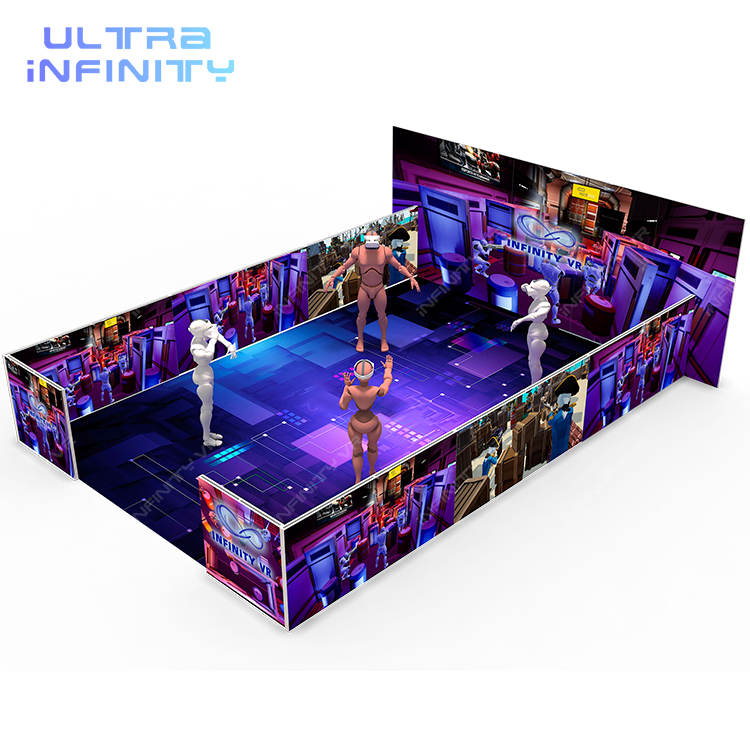
The multiplayer arena shell for venues building around session throughput
Free Roaming VR Arena - Multiplayer VR Shooting Space
The other free-roam walking arena in our range, and a build US venues quote when they are planning around tables per hour rather than around headcount. It is the equipment line in this guide that does not move between states: what moves is the wage you pay the attendant supervising each round and the rent on the tracking floor, which is why the same room is priced at six addresses above rather than at one.
View Details ›
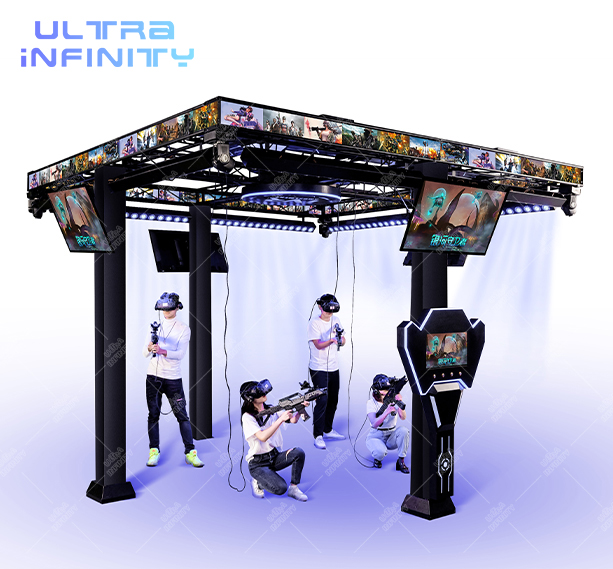
Four players on fixed platforms, the smallest footprint of the three
VR Multiplayer Game Simulator - VR Standing Platform
Where the two walking arenas buy square metres, this build buys wall space: four players shoot from fixed linked platforms, so the room is set by cabinet footprints and clearance measured from the motion arc rather than by an unobstructed play square. For a US lease that is usually the difference between a mall in-line unit and a standalone floor plate, and between a rent that fits the model and one that does not.
View Details ›
Send Us The Room, We Will Price The Fit
Tell us the city, the square footage and the clear height, and our team can put the equipment specification, the play-area layout with clearances, the power callouts and the crate and delivery terms on one page - starting from the free 3D layout design service - so the equipment number in your budget is fixed before the lease conversation starts. The free roaming VR arena 2.0, the multiplayer free-roam VR arena and the four player VR standing platform are the three builds US venues quote most often.

