IAAPA EXPO 2026 PREVIEW - SPORTAINMENT SOURCING
IAAPA Expo 2026 Orlando: The Sportainment Tech Trends to Watch and What They Mean for Your Sourcing
The verified news - IAAPA Expo 2026 runs November 16-20, 2026 at the Orange County Convention Center in Orlando - plus the four sportainment tech trends the show will showcase and the seven-week sourcing plan that turns them into a signed order: free-roam anchors, per-seat density rows, the boutique social wave and the software layer, each priced against the published cost models.
News: IAAPA Expo 2026 Nov 16-20 - Orlando, FL Trend: free-roam anchors Trend: density rows Trend: boutique social 7-week sourcing plan
Nov 16-20
IAAPA Expo 2026 Dates
Orlando FL
Orange County Convention Center
57%
Prefer Multi-Activity Venues
Q1-Q2 2027
The Delivery Window
1. The News: IAAPA Expo 2026 Heads to Orlando, November 16-20
The news first, verified: IAAPA Expo 2026 runs November 16-20, 2026 at the Orange County Convention Center in Orlando, Florida, per IAAPA's official expo calendar. The industry's calendar just passed its European stop - IAAPA Expo Europe closed in London on September 25 - which leaves Orlando as the year's flagship gathering, the week when the attractions industry shows its 2027 pipeline before the buying season opens. IAAPA describes the Expo as the global attractions industry's largest trade show, and the floor spans the whole venue stack: rides, simulators, active gaming, F&B, software and services.
For a sportainment or family-entertainment buyer, though, the date on the calendar matters less than the one behind it. This article publishes about seven weeks before the show floor opens - and seven weeks is the real window. The venues that open in Q1-Q2 2027 are choosing their attraction mix, their budget frame and their supplier shortlist right now; the show itself is where a prepared buyer verifies fabrication and closes terms, not where a plan gets invented. So this is a hybrid piece: the trends the 2026 show will showcase first, then the sourcing math those trends should trigger - with every number anchored to the published models on this site, starting with the published sportainment trends list and the published sportainment opening cost model.
In one line: IAAPA Expo 2026 lands November 16-20 at the Orange County Convention Center in Orlando - and the seven weeks before it, not the four days on the floor, decide whether a 2027 opening is a grand opening or a delay.
2. Trend 1: Free-Roam Multiplayer Arenas as the Anchor Format
The first trend the Orlando floor will confirm: the free-roam multiplayer arena has become the anchor format of the sportainment mix - the attraction a venue is built around rather than added to. The published models explain why. A free-roam arena books 24-40 players per hour on 100-200 square meters, holds guests 35-50 minutes per session, and converts them at the published 60-70% rematch rate - throughput that carries a birthday calendar and a corporate calendar on the same floor. The published free-roam arena dwell study adds the multiplier: guests held 40 extra minutes spend them largely on the F&B floor, and the spectator-screen pattern lifts drink sales around the arena by a published 30%.
What it means for your sourcing: an arena is a capacity decision, not a decoration. Size it to the party calendar you intend to sell - the published VR birthday playbook shows the group formats that anchor arenas sell best - and budget the spectator side from day one, because the published drink-lift is where the arena pays its second dividend. Walk the Orlando stands with two questions per supplier: how many players per hour on my square meters, and what does the scoreboard-and-screens package add to the ticket? The Free Roaming VR Arena 2.0 class of system - a multiplayer VR walking and shooting arena - is the format family the trend describes.
3. Trend 2: Per-Seat Density Rows and the Revenue-per-Square-Meter Race
The second trend runs underneath the first: as rents rise, suppliers are pushing per-seat density - attractions that earn per square meter instead of per square meter of spectacle. The racing row is the textbook case. The published models book 60-90 rides per hour down a row of seats holding 8-12 minutes each, on 4-6 square meters per seat; the published karting model prices a zone at $18-28K to open with $7.5-11K monthly operating cost, a 49-55% margin and a 6-9 month payback. Dart machines, compact shooting bays and the small-seat VR families compete on the same metric - and the published attraction-mix work shows the rows and the anchors stacking, not substituting, inside the $88-135 per-square-meter monthly ceiling.
What it means for your sourcing: take your floor's square meters to the show and price every stand against the ceiling. An anchor that dazzles on video but books 12 players an hour across 200 square meters loses to a row that quietly books 90 rides on 30. The published mall-atrium attraction mix is the worked example of the stack: anchor, density, social, repeat. Compare suppliers on the published 4-6 square meter per-seat spec and the 8-12 minute dwell - the two numbers that turn a seat into a row and a row into a payback. The Motion Racing Simulator Cockpit 6D family is the density class the trend rewards.
4. Trend 3: The Boutique Social Wave - Duckpin, Grid Rooms and LED Floors
The third trend the Orlando floor will push: social format in small footprints. The published survey found 57% of players prefer multi-activity venues against 17% for single-attraction ones - and the supplier response is a wave of compact social attractions: duckpin bowling that opens a lane business at a published $40-48K, interactive grid rooms booking the published $80 per 15-minute session, LED dance floors and interactive tile games that turn party bookings into production values. These are the second-attraction economics - the units that convert a one-ride visit into a two-hour tab without a two-hundred-thousand-dollar build.
What it means for your sourcing: budget the second attraction as deliberately as the anchor. The published duckpin model - about $30,000 of equipment inside that $40-48K open cost - is the cleanest entry ticket to the multi-activity preference the survey measured; the grid room is the highest rate-card item per 15 minutes in the published models; and both sell the party formats that the arenas and rows feed. The Duckpin Bowling System - space-saving lanes designed for bars, hotels and boutique venues - is the wave's signature unit. Ask each stand for the party-package pricing their format supports; the social wave is sold in packages, not tickets.
5. Trend 4: The Software Layer - Cashless Flow, Scoreboards and Rematch Loops
The fourth trend is the least photogenic and the most profitable: the software layer under the hardware. The published operations models keep returning to the same levers - cashless flow that keeps the queue moving (the published queue-reduction playbook makes throughput an F&B revenue issue, not just a service one), scoreboards that publish every session (the published 60-70% rematch rate lives on the leaderboard), and session structures - briefing, calibration, rounds, scoreboard - that turn a machine into a story with an ending. On the 2026 show floor, expect the software demos to sit closer to the hardware than ever: operator dashboards, capacity worksheets and booking calendars sold as part of the ride.
What it means for your sourcing: demo the dashboard, not just the ride. The hardware comparison is visible in the fabrication; the software comparison is where venues win or lose the operating margin - and where the warranty, spare-parts and training clauses earn their keep. Ask what the system exports (utilization per zone per hour), what it integrates (cashless, party bookings), and what the operator certification takes (days, on-site or remote). The published checklists - certifications and pre-shipment - are the two documents to bring to Orlando; both read as supplier scorecards.
6. The Pre-Show Sourcing Plan: Seven Weeks to a Signed Order
Here is the plan the seven-week window supports, week by week. Weeks one and two: define the attraction mix and the budget frame - anchor, density, social - against your floor's square meters and the published $88-135 ceiling, and send the floor plan for a free 3D layout design so the mix is tested before it is bought. Weeks three and four: shortlist three suppliers per format family and send each the same brief - floor area, ceiling height, power, target opening - so the quotes come back comparable. Weeks five and six: use the show days to verify fabrication, lead times and the four contract numbers (lead time, install days, training days, warranty line items), and to walk the trends above with your own eyes rather than a brochure's. Week seven: close. The order placed in the early-Q4 window lands production, shipping and install on the far side of the holidays - and a Q1-Q2 2027 opening stays a date, not a hope.
Two sequencing rules from the published models. First, the mix is chosen before the show, not on it: the published queue and utilization work shows that a venue's revenue problems are layout and mix problems, and neither is fixed in an aisle conversation. Second, the budget is framed before the quotes arrive: buyers who anchor to the published cost models negotiate from numbers, while buyers who anchor to a stand's energy drink negotiate from adrenaline. The published opening-cost model is the frame; the trends are the menu; the show is the verification.
The sourcing sequence: mix and layout in weeks one and two, a three-supplier shortlist by week four, fabrication and contract numbers verified on the floor, and the order placed in the early-Q4 window - that is how the November show delivers a 2027 opening instead of a 2027 excuse.
7. The Numbers to Negotiate Against: Published Cost Anchors
Walk the floor with numbers, not vibes. The table below collects the published cost and revenue anchors from this site's models - the figures each format family earns and costs - so every Orlando quote lands next to a reference instead of a blank page. Where a published model exists, the anchor is a range; where only scenario work exists, the note says so. Suppliers respect buyers who know the published yardsticks, and the fastest way to test a supplier is to compare their number to the published one and watch what they say.
| Format family |
Published open cost |
Published revenue anchor |
Sourcing note |
| Free-roam VR arena |
Project-scale (quote by m2) |
24-40 players/hr; 35-50 min dwell; 60-70% rematch |
Size to the party calendar; add spectator screens (+30% drinks) |
| Racing / per-seat row |
$18-28K per karting zone |
60-90 rides/hr; 4-6 m2/seat; $6-9 heat |
Density play; verify m2/seat and dwell, not screen size |
| Laser tag arena |
$86-118K CAPEX |
Breakeven at 27% occupancy (published model) |
Software and vest logistics decide the operating margin |
| Duckpin lanes |
$40-48K open |
Hosted-lane party formats; 2-6 players/lane |
The boutique social entry; ask for party-package rates |
| Grid / LED interactive |
Unit-scale (quote by size) |
$80 per 15-min session (published) |
Highest rate-card per 15 minutes; party production value |
| VR chairs / compact seats |
$6-12K per chair |
$130-320 per chair/day; ~4.5-mo payback |
Filler density; check harness and service kit in person |
Two anchors the table does not carry but the negotiation should: the published $88-135 per-square-meter monthly ceiling, which frames the whole mix against your floor, and the published karting operating pattern - $7.5-11K monthly, 49-55% margin, 6-9 month payback - which is the cleanest template for how a per-seat zone behaves after opening. A supplier quote that cannot be reconciled with the published ceiling is not a discount; it is a layout problem wearing a price tag.
Scenario: Hours Booked per Week by Format (EXAMPLE mix, one 800m2 floor)
Source: worked scenario (EXAMPLE) - weekly booked hours by format on a sample 800m2 floor, arranged for readability; follows the published mix-stack pattern and the $88-135/m2 ceiling. Planning reference, not a forecast.
Where a Sample $500K Sportainment Budget Goes (EXAMPLE allocation)
- Anchor arena 34
- Racing / density rows 18
- Duckpin social lanes 14
- Grid / LED interactive 10
- Install and fit-out 16
- Training, spares, warranty 8
Source: worked scenario (EXAMPLE) - allocation of a sample $500K project budget across a published-mix stack (anchor, density, social) plus fit-out and after-sales. Anchored to the published cost ranges; shares are planning references, not quotes.
8. The Takeaway: Orlando Is a Deadline, Not a Field Trip
The news is simple: IAAPA Expo 2026, November 16-20, Orange County Convention Center, Orlando. The analysis is simpler still: the four trends the show will showcase - free-roam anchors, density rows, boutique social, the software layer - are already priced in the published models, and the seven weeks before the show are when a prepared buyer turns those prices into a mix, a layout and a shortlist. Attend the show to verify fabrication and close terms; do the deciding beforehand. The venues opening in Q1-Q2 2027 are being signed this November - and the suppliers' best lead times go to the buyers who arrived with their numbers ready.
The buyer's one-line brief for Orlando: know your square meters and your ceiling, shortlist before you fly, verify fabrication on the floor, and sign in the early-Q4 window - the published models have already done the homework; the show just has to confirm it.
9. Frequently Asked Questions (FAQ)
When and where is IAAPA Expo 2026?
IAAPA Expo 2026 runs November 16-20, 2026 at the Orange County Convention Center in Orlando, Florida, per IAAPA's official calendar - education sessions across the week, the show floor at mid-week. IAAPA Expo Europe (London, September 21-25) has already closed, so Orlando is the industry's remaining flagship stop this year.
Why does the expo matter for a venue buyer who is not attending?
Because the show compresses the industry's product cycle into one week: the formats suppliers push in Orlando are the formats filling 2027 floors. The sourcing decisions that decide a Q1-Q2 2027 opening - the attraction mix, the budget frame, the supplier shortlist - are made in the seven weeks before the show, not in the aisles. This guide turns the show's trends into that pre-show checklist.
What are the sportainment tech trends for 2026-2027?
Four, per the published trend analysis: free-roam multiplayer arenas as the anchor format (24-40 players per hour on 100-200m2, 35-50 minute dwell); per-seat density rows for revenue per square meter (racing rows at 60-90 rides per hour); the boutique social wave (duckpin lanes, interactive grid rooms, LED floors); and the software layer - cashless flow, scoreboards and the rematch loops that book the published 60-70% rematch rate.
When should I order equipment to open in 2027?
Work backward from the opening: production, shipping and install consume the quarter after an order, and fit-out runs alongside. A venue targeting Q1-Q2 2027 should shortlist suppliers in the seven pre-show weeks, use the expo to compare build quality and lead times, and place the order in the early Q4 window that follows. Ordering at the show is not late - ordering six months after it is.
How do I compare suppliers at a trade show?
Ignore the demo videos and inspect the fabrication: weld quality, harness stitching, panel seams, the spare-parts kit on the stand, and the operator dashboard behind the ride. Ask every supplier the same four numbers - lead time, install days, training days and the warranty line items - then rank the shortlist on answers, not graphics. The published pre-shipment and certification checklists travel well as a pocket brief.
How much budget does a multi-attraction sportainment venue need?
Anchor to the published numbers: a karting zone opens at $18-28K with $7.5-11K monthly operating cost and a 6-9 month payback; a laser tag arena runs $86-118K CAPEX; duckpin opens at $40-48K; VR chairs sit at $6-12K each returning $130-320 per chair per day. The published revenue ceiling - $88-135 per square meter monthly - is the frame that keeps the total honest: budget the mix against the floor's square meters, not against the showroom demo.
10. Featured NextPlay Active Gaming Equipment
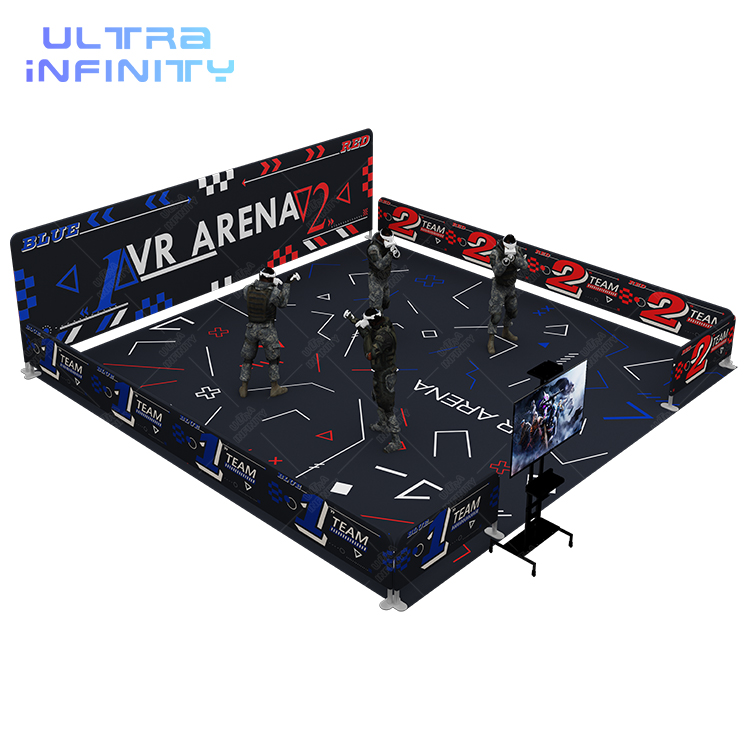
Trend 1: the anchor
Free Roaming VR Arena 2.0 - Multiplayer VR Walking Shooting Simulator
The free-roam arena behind the published 24-40 players per hour and 35-50 minute dwell - the format the 2026 show floor will anchor around.
View Details ›
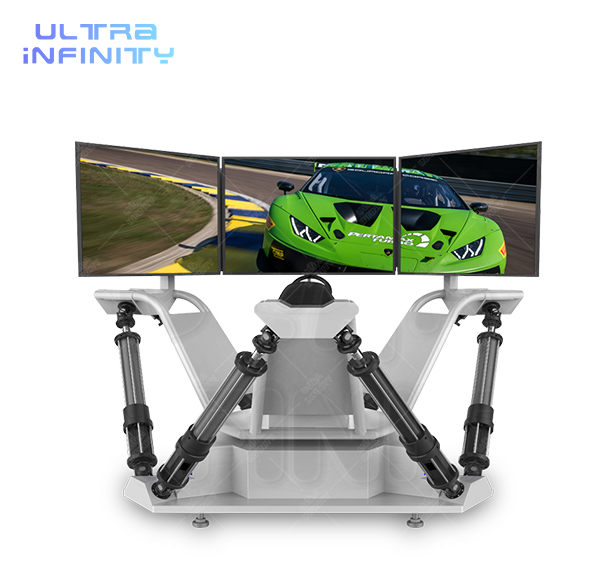
Trend 2: the density row
Motion Racing Simulator Cockpit 6D Best F1 Racing Game Seats
The per-seat row behind the published 60-90 rides per hour - the square-meter workhorse the trend rewards.
View Details ›
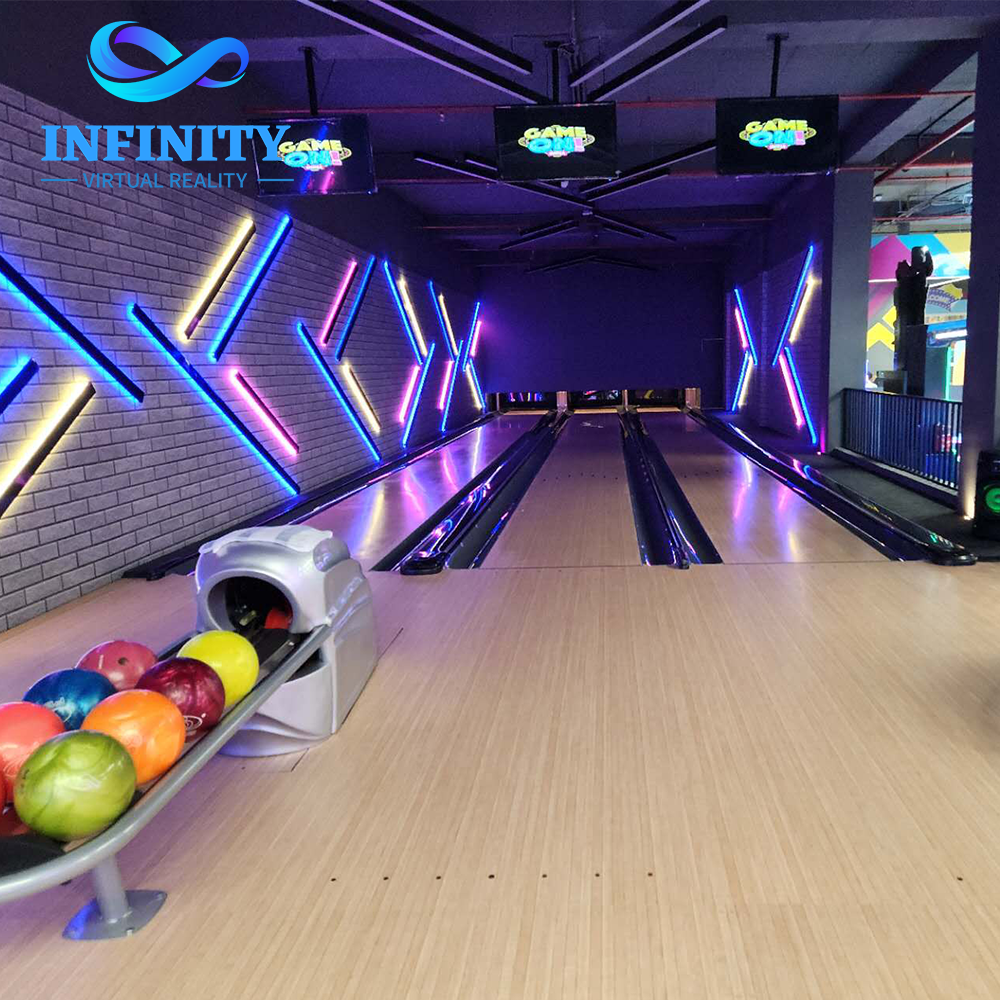
Trend 3: the social wave
Duckpin Bowling System for Full Venue Solution - Space-Saving Design, Easy Installation
The space-saving duckpin build behind the published $40-48K open model - the boutique second attraction the survey's 57% prefer.
View Details ›

