BASEBALL BATTING SIMULATOR - THE PUBLISHED PROFITABILITY MODEL
How Profitable Is a Baseball Batting Simulator Zone for Sports Entertainment Venues?
The published profitability math: a batting bay books a published $15-25 swing-and-session price ladder on 10-15m2, a four-bay zone grosses about $5,200-14,000 a month across the 30-70% utilization band, and the payback lands inside the published simulator window.
$15-25 session ladder 16-24 sessions/hour zone 30-70% utilization band $5.2K-14K monthly gross 10-15m2 per bay About 12 mo scenario payback
$15-25
Published Session Band
16-24/hr
Zone Sessions Per Hour
$5.2K-14K
Scenario Monthly Gross
About 12 mo
Scenario Payback
1. The Batting Simulator Zone: A Compact Attraction With a Serious Question Attached
Baseball batting simulators have quietly become the precision-sport anchor of sports entertainment venues - a screen, a tracking system, a projected pitcher, and a 10-15m2 footprint per bay that fits floors a full lane cannot. The profitability question deserves better than vendor brochures, so this guide builds the answer the way the published zone models do: published pricing anchors, published utilization bands, published margins - and one clearly-labeled worked scenario that turns them into monthly revenue, cost lines and payback.
The scenario: a four-bay zone inside a 600m2 sports entertainment venue - the compact stack the published equipment ranking pairs with duckpin lanes and an LED grid room. Each bay books single swings, 30-minute practice blocks and team sessions off a $15-25 ladder. The question: what does that zone actually earn, at the published utilization band, against its costs?
The answer in one line: four bays book 16-24 sessions per hour at full queue, gross about $5,200-14,000 a month across the published 30-70% utilization band, clear a scenario $4,800 fixed stack at about 33% utilization - and the per-bay math lands inside the published $88-135 per square meter ceiling.
2. Revenue Lines: The $15-25 Session Ladder and Where It Comes From
The published anchors price the family first. The karting heat books $6-9 per six minutes (blog 795), the active-gaming room books up to $80 per 15-minute session for 4-8 players (blog 2483), and the archery lane books $12-20 per 15-minute session on the published archery model - precision-sport bays cluster at $12-25 per session, and batting sits naturally at a $15-25 ladder: $15 for a single-swing session, $25 for a 30-minute practice block, team and league rates quoted per lane-hour. That ladder is a scenario framing on published anchors, chosen because it matches the family's per-session band and leaves room for team premiums.
The session mix is where batting diverges from VR rows. The published kids-karting model shows the stack pattern: single sessions carry the top line, then packs, then parties, then scheduled events - roughly two thirds of gross from repeatable formats. A batting zone runs the same stack with a training accent: single swings for walk-ins, practice blocks for regulars, team bookings for the youth market, and birthday slots on weekend afternoons. The published earnings guide frames the destination: the zone's per-square-meter yield has to land inside the published $88-135/m2 ceiling, and the mix - not the walk-in - is what pushes it there.
The Scenario Session Mix (EXAMPLE - share of four-bay monthly gross)
- Single-swing sessions ($15) 38
- 30-minute practice blocks ($25) 27
- Team and league bookings 21
- Birthday and party slots 14
Source: worked scenario following the published revenue-stack pattern (kids-karting model, blog 795: single heats 40%, packs 26%, parties 21%, school events 13%); the batting mix reweights the same structure toward training blocks and teams. Shares are planning references on the published models, not guarantees.
3. Capacity Math: 16-24 Sessions Per Hour, Stated Basis Included
Capacity is the honesty test for any zone model, so the basis is stated up front. A batting bay runs a 10-15 minute session loop - swings, ball collection, reset - which serves 4-6 sessions per hour per bay; a four-bay zone therefore accumulates 16-24 sessions per hour at full queue, per the same per-seat independence the published simulator rows use to book 60-90 rides per hour. Realistic demand never holds full queue all day, which is exactly why the published models quote a 30-70% utilization band instead of a peak number - the band, not the peak, is what a month actually books.
Scenario Monthly Gross Across the Published Utilization Band (USD, four bays)
At 30% utilization
$5,200
At 50% utilization
$9,400
At 70% utilization
$14,000
Published laser arena at 30% (context)
$22,464
Source: worked scenario - four bays x 16-24 sessions/hour x the $15-25 session ladder, scaled across the published 30-70% utilization band (blog 2681); the laser arena bar is the published context anchor (blog 2681). The bars deliberately interleave the batting zone with the published laser anchor to show the scale gap between compact zones and hosted arenas. Scenario figures are planning references, not guarantees.
Queue discipline is a published lever, not an afterthought. The published queue-management playbook shows the pre-booking and stagger system that fills every seat without the wait - session lengths staggered across attractions, the scoreboard rerouting walk-ins, the booking slots that convert a queue into a schedule - and the published floor-balance design guide shows how the surrounding floor is arranged so no single bay becomes the bottleneck. A batting zone that publishes its session grid books the 70% end of the band; one that improvises lives at 30% with the same hardware.
4. Cost Lines, the Worked P&L and Payback - With Assumptions Stated
Planning assumptions, stated in one place. The worked model rests on: (1) a four-bay zone at a $60,000-110,000 scenario installed budget on 10-15m2 per bay (footprint framing on the published compact-attraction comparison; installed cost is scenario pending supplier quote); (2) a scenario $4,800 monthly fixed stack - rent share, one shared attendant, utilities, maintenance reserve; (3) the $15-25 scenario session ladder on the published $12-25 precision-bay band; (4) the published 30-70% utilization band; (5) a 50-55% contribution margin based on the published 49-55% karting zone margin. Replace any assumption with a quote and the model reruns.
| Line |
Scenario / Published Value |
Basis |
| Session ladder |
$15 single / $25 block / team rates |
Scenario framing on published $12-25 precision-bay band |
| Bay throughput |
4-6 sessions/hour per bay; 16-24 zone |
10-15 min loop, per-seat independence (published) |
| Monthly gross |
$5,200-14,000 across 30-70% utilization |
Scenario math on the published band |
| Monthly fixed stack |
$4,800 |
Scenario: rent share, attendant, utilities, maintenance |
| Contribution margin |
50-55% |
Based on published 49-55% karting margin (blog 795) |
| Per-m2 check |
Inside $88-135/m2 ceiling |
Published ceiling (blog 828) |
| Payback (mid-band plan) |
About 12 months |
Scenario; published ladder 4.5-9 months for VR entries |
The payback read: at the band ceiling the zone clears its stack with $9,200 a month of scenario contribution, which repays the $60,000-110,000 installed budget in roughly 7-12 months of sustained mid-band performance - and the published ladder brackets the expectation: about 4.5 months for the chair fleet (per the published chair model), 6-9 for the karting row (per the published kids-karting model), 8 for the battleship cinema. The published year-one mistakes list is the closing warning: the venues that miss payback usually booked the hardware but skipped the team outreach, league scheduling and opening calendar that fill weekday slots before the walk-in habit forms.
5. Frequently Asked Questions (FAQ)
How much revenue can a baseball batting simulator zone generate?
On the worked model in this guide: a four-bay zone booking a $15-25 session ladder across the published 30-70% utilization band grosses about $5,200-14,000 a month, before league nights and party packages. The per-bay engine is close to the published simulator economics - a $15-25 session on 10-15m2 lands inside the published $88-135 per square meter ceiling - and the zone-level number follows the published pattern where stacked session types (single swings, 30-minute blocks, leagues, birthdays) carry two thirds of revenue.
How much does a baseball batting simulator cost to install?
A commercial batting bay is a screen-plus-tracking-plus-projection build on a 10-15m2 footprint, so its installed cost lands in the same tier as the published simulator entries - above a single VR chair ($6,000-12,000 published) and below a hosted arena ($95,000-160,000 published). A practical scenario budget for a four-bay zone with ball tracking, HD projection and netting runs $60,000-110,000, and the published cost analysis is the template for pricing the fit-out lines around it. Because the pricing is quote-driven, the honest planning move is to state the range, label it, and replace it with a supplier quote.
How many players per hour can a batting bay serve?
A bay runs a 10-15 minute session loop including ball collection and reset, so a single bay serves 4-6 sessions per hour, and a four-bay zone accumulates 16-24 sessions per hour when the queue holds - the same per-seat independence that lets the published simulator rows book 60-90 rides per hour. Sessions are bookable one player at a time, which is what separates batting bays from group formats: the revenue arrives in small independent tickets rather than a single 16-player booking.
Is a batting simulator better business than a golf simulator?
They share the economics and split the calendar. Both are screen-and-sensor bays on similar footprints with similar session pricing, so the choice is audience-driven: golf books steady adult and corporate rounds, batting catches teams, leagues and the youth-training market with faster session loops. The published venue models treat them as the same family - precision-sport bays that fill weekday off-peak - and the published attraction-mix analysis shows venues pairing both to cover different dayparts of the same week.
What utilization does a batting zone need to break even?
On the scenario model: a four-bay zone at the $15-25 session ladder covers a scenario $4,800 monthly fixed stack at about 33% utilization, sits inside the published 30-70% band by construction, and reaches its published-band ceiling at 70% - where the same four bays gross about $14,000. The lever set is the published one: team bookings, league nights and birthday packages push utilization up the band faster than walk-ins ever do.
How fast does a batting simulator zone pay back?
The published payback ladder for compact simulator formats runs from about 4.5 months (chair fleet) to 6-9 months (karting row) on the published models. A four-bay batting zone with a mid-band utilization plan lands payback in roughly a year on the scenario model - slower than the VR entries because the installed cost is higher per zone, faster than hosted arenas because the sessions book one player at a time from day one. The published equipment ranking's sequencing rule applies: prove utilization on the fastest formats, then fund the bays.
6. Featured NextPlay Active Gaming Equipment
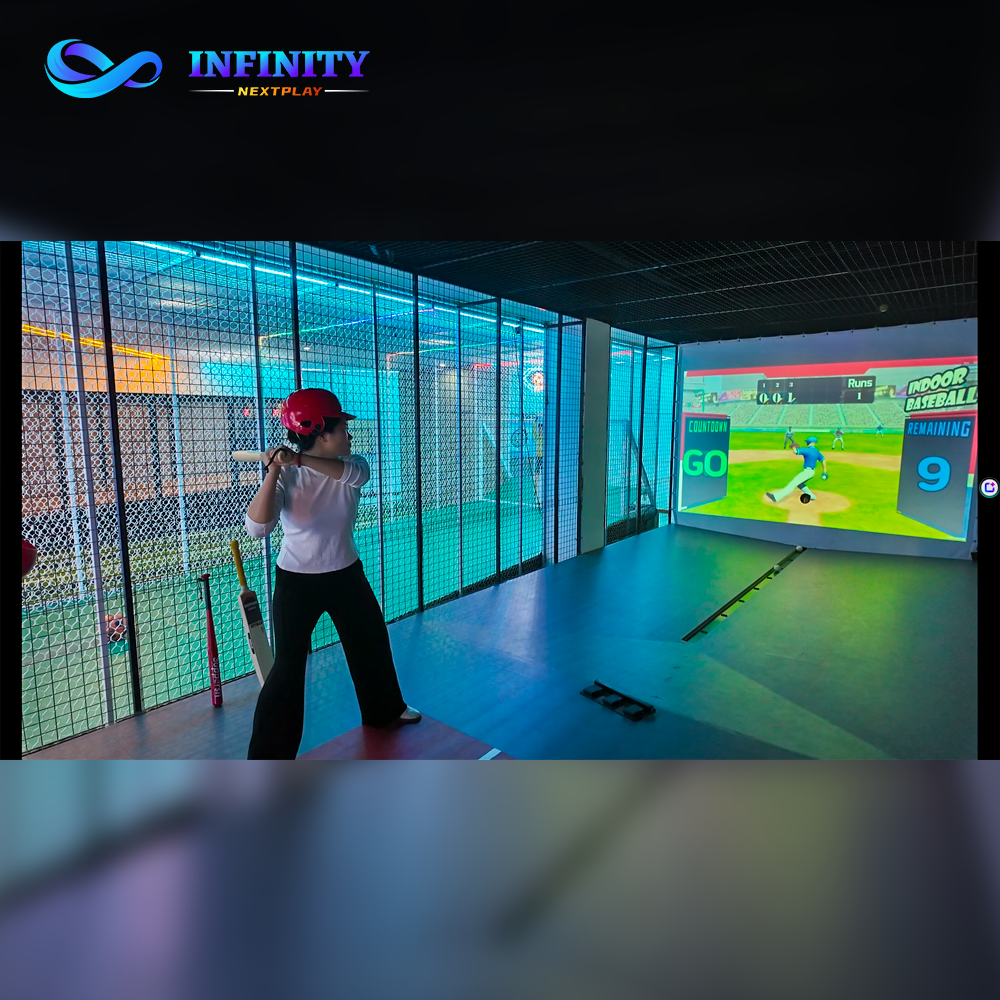
The zone itself
Immersive Indoor Baseball Batting Simulator - Real-time Ball Tracking HD Projection
The tracking-plus-projection bay behind the $15-25 session ladder and the 16-24 sessions-per-hour zone math.
View Details ›
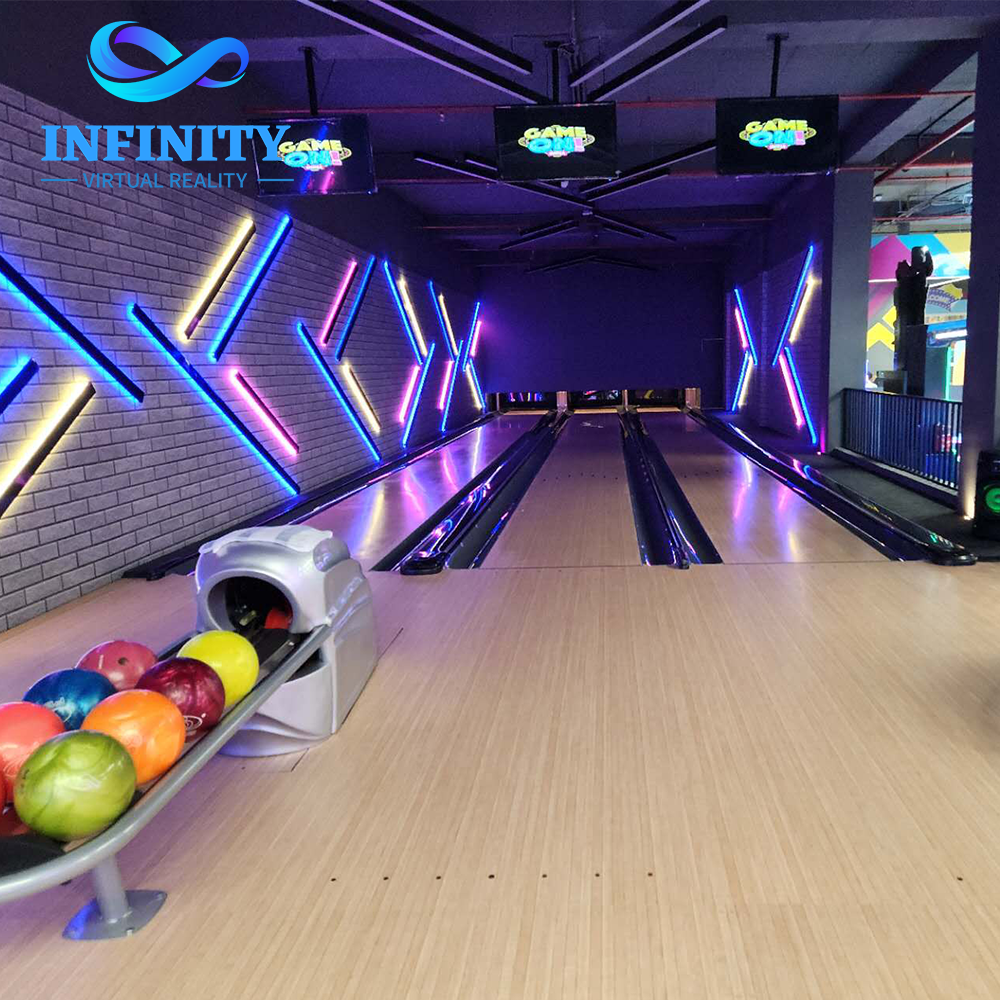
The pairing anchor
Duckpin Bowling System for Full Venue Solution
The hosted-lane partner in the published equipment ranking - the group format that shares the batting zone's calendar.
View Details ›
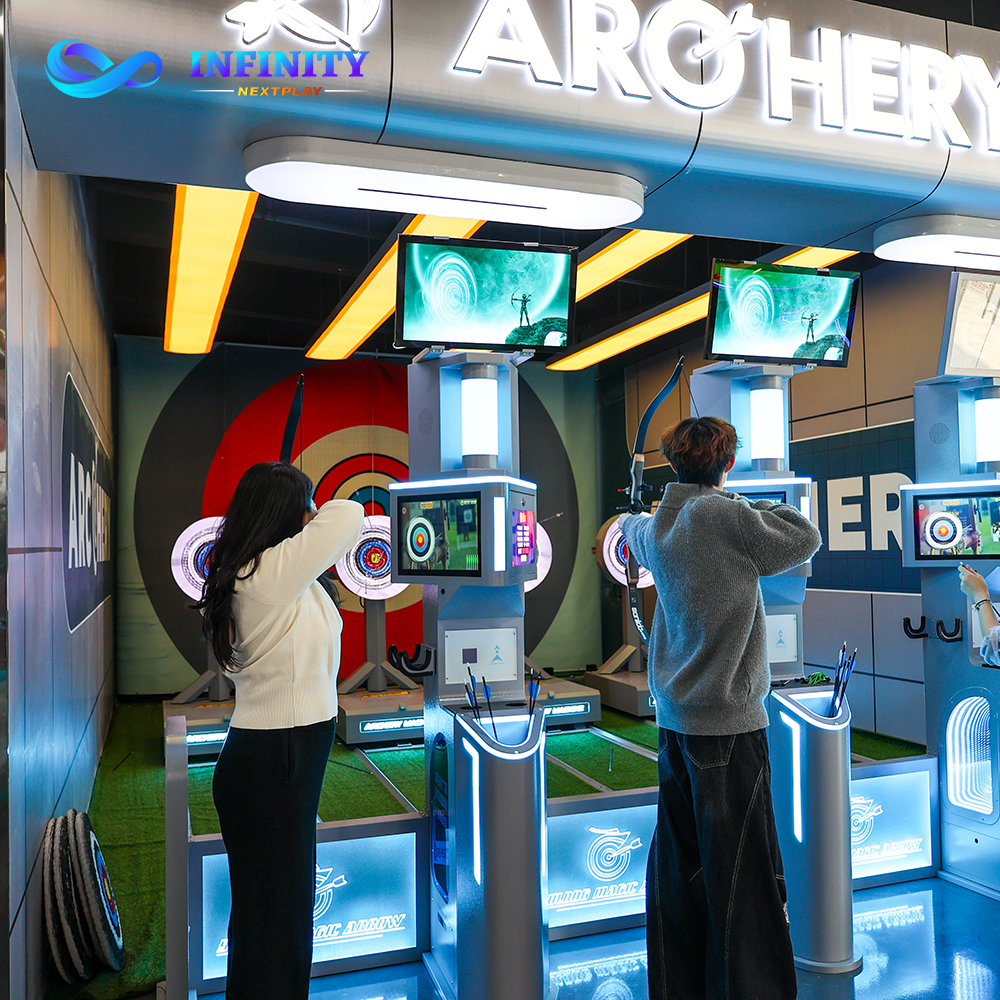
The sibling bay
Digital Archery Simulator for Full Venue Solution - Adjustable Track Distance
The $12-20 published session sibling - the precision-sport bay family that fills the same off-peak weekday slots.
View Details ›

